OPEN-SOURCE SCRIPT
Dashboard Trends
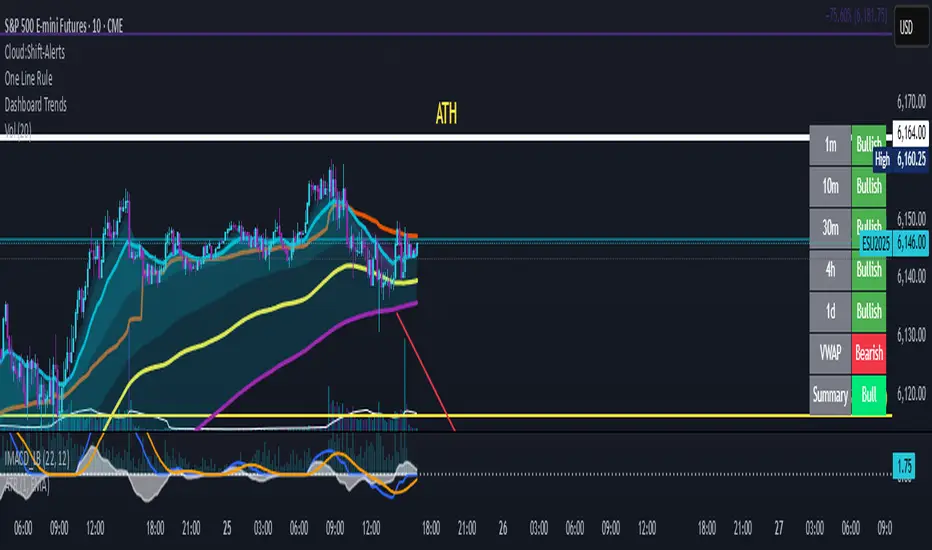
📊 Dashboard Trends + Anchored Daily VWAP
This indicator provides a real-time multi-timeframe trend dashboard alongside a daily anchored VWAP system, helping you assess both macro and intraday market sentiment at a glance.
🔍 Key Features
✅ Multi-Timeframe Trend Analysis
Tracks whether EMA(22) is above EMA(200) across:
1m, 10m, 30m, 4h, 1D timeframes
Color-coded "Bullish"/"Bearish" status for each
Aggregated trend summary using 6 signals (including VWAP)
✅ Anchored Daily VWAP
Uses ta.vwap to provide a session-resetting daily VWAP
VWAP resets at the beginning of each trading day
Live update throughout the day
Supports pre-market and after-hours if chart includes ETH
✅ VWAP Bands (±1σ to ±3σ)
Optional bands show price deviation from VWAP
Fully customizable:
Enable/disable each band
Set deviation multiplier
Adjust color and visibility
✅ Visual Dashboard
Table display in the bottom-right corner
Shows trend status per timeframe + VWAP + Summary
Easy-to-read green/yellow/red color codes
⚙️ Customization
Toggle VWAP line on/off
Enable or disable any band level
Adjust standard deviation multiplier
Choose your VWAP and band colors
🧠 Summary Logic
Strong Bull: 6 bullish signals
Bull: 5 signals
Mixed: 3–4 signals
Bear: 2 signals
Strong Bear: 0–1 signals
This tool is perfect for traders looking to combine trend-following and intraday mean-reversion awareness, with all the critical data visualized in one compact dashboard.
開源腳本
秉持TradingView一貫精神,這個腳本的創作者將其設為開源,以便交易者檢視並驗證其功能。向作者致敬!您可以免費使用此腳本,但請注意,重新發佈代碼需遵守我們的社群規範。
免責聲明
這些資訊和出版物並非旨在提供,也不構成TradingView提供或認可的任何形式的財務、投資、交易或其他類型的建議或推薦。請閱讀使用條款以了解更多資訊。
免責聲明
這些資訊和出版物並非旨在提供,也不構成TradingView提供或認可的任何形式的財務、投資、交易或其他類型的建議或推薦。請閱讀使用條款以了解更多資訊。