INVITE-ONLY SCRIPT
Specter Alpha-Omega Volatility Index™
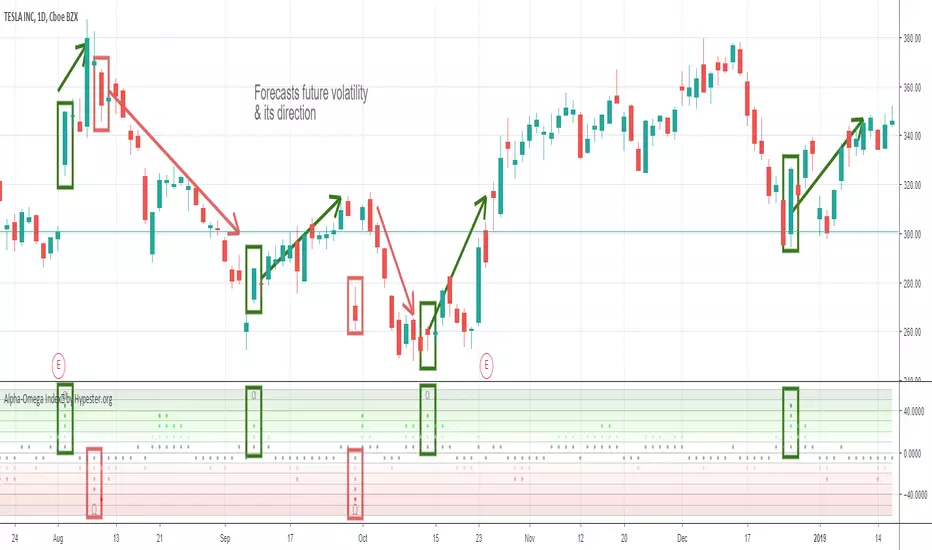
Meet the Alpha-Omega Volatility custom indicator by Specter
This premium volatility indicator uses a series of models to compare historical volatility, and by using a series of noise reduction techniques, it only gives you the very best signals. This indicator shows you aggressive reversals, which are often the most profitable.
The customization options already come with pre-sets, and it's as simple as one click. It comes with Aggressive, Moderate, Conservative and Ultra Conservative behaviors filters.
Also, it offers an interest zone indicator so you can start paying attention to the chart before it happens when trading extra volatile stocks timing is crucial and you want to be ready before the action begins.
The way you use it is pretty simple, you look for divergences. When you have a bullish movement, and you see high negative volatility appearing in the Alpha-Omega indicator, it means a strong reversal/spike is coming. The same goes for bearish reversals, just the opposite logic. You also get an extra layer of confirmation which is the Alpha/Omega characters; they only appear with the most robust volatility prediction. It's up to your trading strategy to decide how conservative you are and which signals you will follow.
It works on any market/security/asset/timeframe.
Ready to ride some spikes?
僅限邀請腳本
僅作者批准的使用者才能訪問此腳本。您需要申請並獲得使用許可,通常需在付款後才能取得。更多詳情,請依照作者以下的指示操作,或直接聯絡spectertrading。
TradingView不建議在未完全信任作者並了解其運作方式的情況下購買或使用腳本。您也可以在我們的社群腳本中找到免費的開源替代方案。
作者的說明
免責聲明
這些資訊和出版物並非旨在提供,也不構成TradingView提供或認可的任何形式的財務、投資、交易或其他類型的建議或推薦。請閱讀使用條款以了解更多資訊。
僅限邀請腳本
僅作者批准的使用者才能訪問此腳本。您需要申請並獲得使用許可,通常需在付款後才能取得。更多詳情,請依照作者以下的指示操作,或直接聯絡spectertrading。
TradingView不建議在未完全信任作者並了解其運作方式的情況下購買或使用腳本。您也可以在我們的社群腳本中找到免費的開源替代方案。
作者的說明
免責聲明
這些資訊和出版物並非旨在提供,也不構成TradingView提供或認可的任何形式的財務、投資、交易或其他類型的建議或推薦。請閱讀使用條款以了解更多資訊。