PROTECTED SOURCE SCRIPT
已更新 Simple Price Action [Luxmi AI]
Introducing the Simple Price Action Indicator
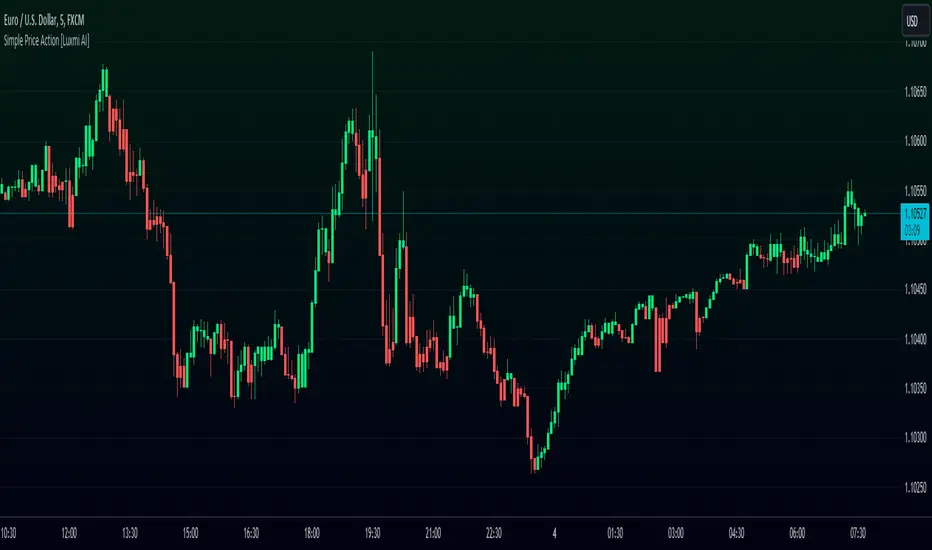
The Simple Price Action Indicator is designed to help traders quickly identify market trends and make informed decisions. This custom-built Pine Script tool changes candle colors on your chart based on price movement:
- Lime Green Candles indicate bullish momentum when the current price closes above the previous candle’s high.
- Red Candles signal bearish momentum when the price closes below the previous candle’s low.
Alongside these visual cues, the indicator generates Buy and Sell signals based on color changes:
- A buy signal appears when a red candle turns green.
- A sell signal shows up when a green candle turns red.
These signals are displayed directly on the chart as small labels ("B" for buy and "S" for sell), helping you easily spot trading opportunities. You can also set up alerts to notify you whenever a new signal is triggered, ensuring you never miss a trade.
The Simple Price Action Indicator is a straightforward yet effective tool for traders looking to enhance their price action analysis.
How It Works: Under the Hood
The script begins by defining two key colors—lime green for bullish candles and red for bearish candles. It then determines the candle color based on the closing price relative to the previous candle's high and low. If a bullish or bearish condition is met, the candle is colored accordingly.
Next, the script checks for a change in candle color to generate buy and sell signals. If a candle turns green after being red, a buy signal is plotted below the candle. If a candle turns red after being green, a sell signal is plotted above the candle.
Finally, the script includes alert conditions that correspond to these buy and sell signals, ensuring you can react quickly to potential trades.
發行說明
Introducing features to color bars and enable/disable labels.受保護腳本
此腳本以閉源形式發佈。 不過,您可以自由使用,沒有任何限制 — 點擊此處了解更多。
免責聲明
這些資訊和出版物並非旨在提供,也不構成TradingView提供或認可的任何形式的財務、投資、交易或其他類型的建議或推薦。請閱讀使用條款以了解更多資訊。
免責聲明
這些資訊和出版物並非旨在提供,也不構成TradingView提供或認可的任何形式的財務、投資、交易或其他類型的建議或推薦。請閱讀使用條款以了解更多資訊。