OPEN-SOURCE SCRIPT
CUSTOM intraday volatility chart clock
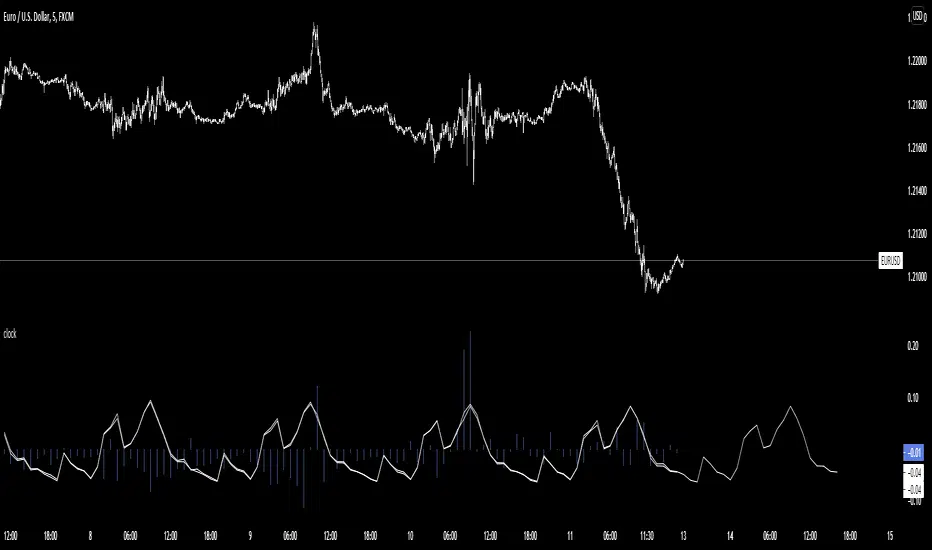
Chart clock showing an overview of the day's expected and actual intraday volatility.
In white are only the expected volatility scores. The expected increase or decrease in volatility at any given hour of day compared to the average of the whole day's expected volatility. A 0.5 score two hours from now means that you can expect that hour to be 0.5% more volatile than the average of whole day's volatility.
In blue are the actual or realized volatility scores; the difference between that hour's volatility and what was expected to be its volatility is displayed as a blue bar. If two three hours ago was expected to be a more volatile hour of the day but no movement occurred, a large down bar will print for that hour.
Large swings of daily volatility (i.e. this month is much more or much less volatility than the last) will bias the clock usually only a little higher or lower, although historical volatility peaks/depressions will show the blue realized volatility score to be consistently high/low.
If requested I can change the look of the indicator or add input settings for the input length of clock, which for now is set to 20 bars, which is an approximation of the last month's realized volatility.
開源腳本
秉持TradingView一貫精神,這個腳本的創作者將其設為開源,以便交易者檢視並驗證其功能。向作者致敬!您可以免費使用此腳本,但請注意,重新發佈代碼需遵守我們的社群規範。
免責聲明
這些資訊和出版物並非旨在提供,也不構成TradingView提供或認可的任何形式的財務、投資、交易或其他類型的建議或推薦。請閱讀使用條款以了解更多資訊。
免責聲明
這些資訊和出版物並非旨在提供,也不構成TradingView提供或認可的任何形式的財務、投資、交易或其他類型的建議或推薦。請閱讀使用條款以了解更多資訊。