OPEN-SOURCE SCRIPT
Liquidity Heatmap & Volume-Weighted RSI
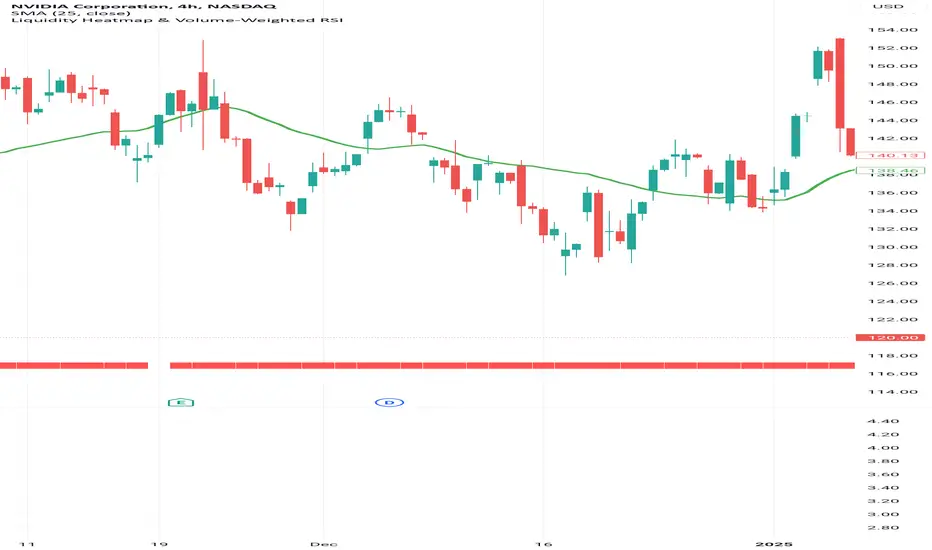
Liquidity Heatmap Indicator with Volume-Weighted RSI
Description:
The Liquidity Heatmap Indicator with Volume-Weighted RSI (VW-RSI) is a powerful tool designed for traders to visualize market liquidity zones while integrating a volume-adjusted momentum oscillator. This indicator provides a dynamic heatmap of liquidity levels across various price points and enhances traditional RSI by incorporating volume weight, making it more responsive to market activity.
Key Features:
Liquidity Heatmap Visualization: Identifies high-liquidity price zones, allowing traders to spot potential areas of support, resistance, and accumulation.
Volume-Weighted RSI (VW-RSI): Enhances the RSI by factoring in trading volume, reducing false signals and improving trend confirmation.
Customizable Sensitivity: Users can adjust parameters to fine-tune heatmap intensity and RSI smoothing.
Dynamic Market Insights: Helps identify potential price reversals and trend strength by combining liquidity depth with momentum analysis.
How to Use:
1. Identify Liquidity Zones: The heatmap colors indicate areas of high and low liquidity, helping traders pinpoint key price action areas.
2. Use VW-RSI for Confirmation: When VW-RSI diverges from price near a liquidity cluster, it signals a potential reversal or continuation.
3. Adjust Parameters: Fine-tune the RSI period, volume weighting, and heatmap sensitivity to align with different trading strategies.
This indicator is ideal for traders who rely on order flow analysis, volume-based momentum strategies, and liquidity-driven trading techniques.
開源腳本
秉持TradingView一貫精神,這個腳本的創作者將其設為開源,以便交易者檢視並驗證其功能。向作者致敬!您可以免費使用此腳本,但請注意,重新發佈代碼需遵守我們的社群規範。
免責聲明
這些資訊和出版物並非旨在提供,也不構成TradingView提供或認可的任何形式的財務、投資、交易或其他類型的建議或推薦。請閱讀使用條款以了解更多資訊。
開源腳本
秉持TradingView一貫精神,這個腳本的創作者將其設為開源,以便交易者檢視並驗證其功能。向作者致敬!您可以免費使用此腳本,但請注意,重新發佈代碼需遵守我們的社群規範。
免責聲明
這些資訊和出版物並非旨在提供,也不構成TradingView提供或認可的任何形式的財務、投資、交易或其他類型的建議或推薦。請閱讀使用條款以了解更多資訊。