PROTECTED SOURCE SCRIPT
ATR & Price Z-Score
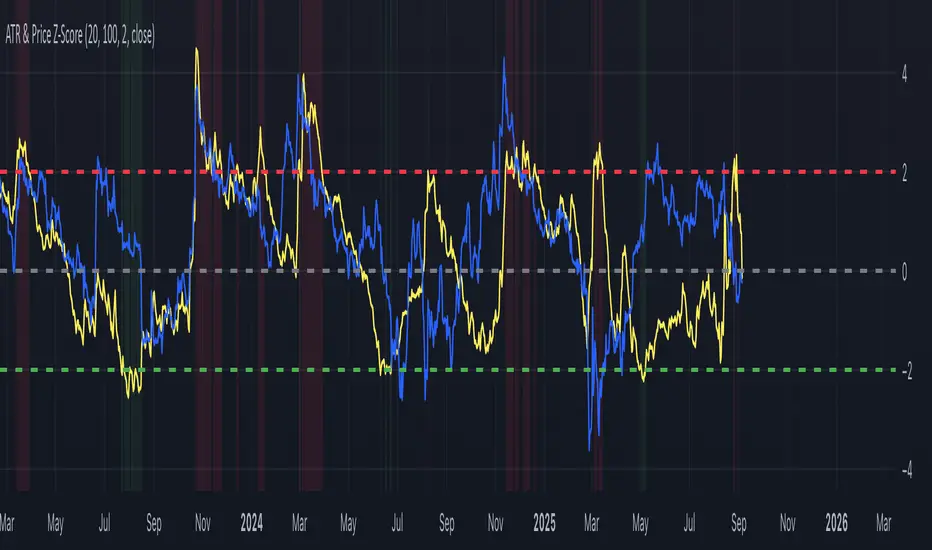
This indicator combines the ATR Z-Score and the Price Z-Score into a single framework for evaluating market conditions using statistical context. The ATR Z-Score standardizes volatility by comparing the current ATR value to its historical mean and standard deviation, allowing traders to see when volatility is unusually high (above +2) or unusually low (below –2). The Price Z-Score applies the same normalization process to price itself, showing how far the current close is from its moving average in standard deviation terms, which highlights statistically stretched conditions that often align with overbought or oversold states. By plotting both measures together, traders can identify when price moves are supported by volatility or when the two diverge. For example, a high Price Z paired with a high ATR Z can confirm the strength of a breakout, while a high Price Z with a low ATR Z may suggest an unsustainable move lacking volatility support. Conversely, a volatility spike without an extreme in price can point to shakeouts or regime shifts. Because both measures are normalized, they can be compared across different markets and timeframes, making the indicator useful for spotting breakouts, squeezes, reversals, and abnormal conditions in a statistically consistent way.
受保護腳本
此腳本以閉源形式發佈。 不過,您可以自由使用,沒有任何限制 — 點擊此處了解更多。
免責聲明
這些資訊和出版物並非旨在提供,也不構成TradingView提供或認可的任何形式的財務、投資、交易或其他類型的建議或推薦。請閱讀使用條款以了解更多資訊。
受保護腳本
此腳本以閉源形式發佈。 不過,您可以自由使用,沒有任何限制 — 點擊此處了解更多。
免責聲明
這些資訊和出版物並非旨在提供,也不構成TradingView提供或認可的任何形式的財務、投資、交易或其他類型的建議或推薦。請閱讀使用條款以了解更多資訊。