OPEN-SOURCE SCRIPT
SPYIX EMA
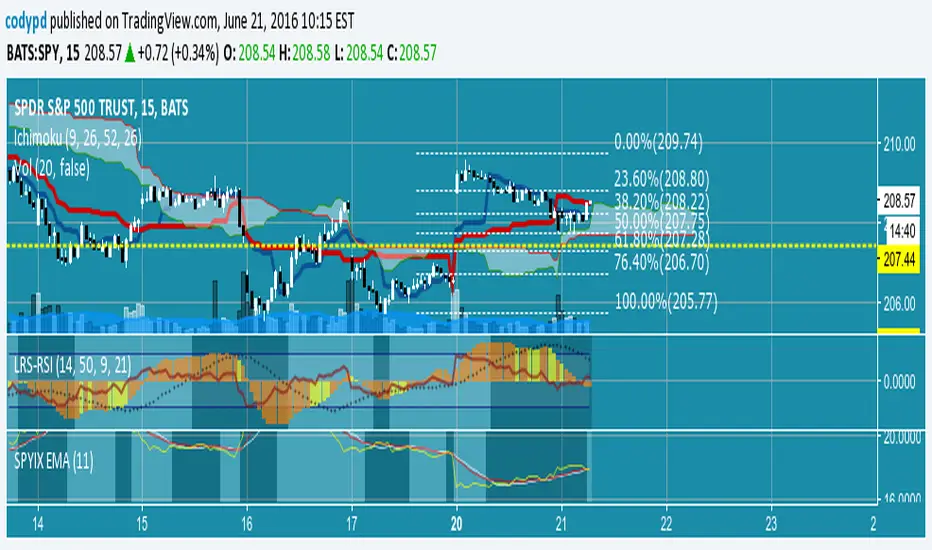
Variation on idea at url below using SPYIX from BATS instead of VIX
from marketsci.wordpress.com/2008/07/28/the-vix-is-very-predictable/
Aids in identifying changes in volatility direction.
EDIT: just noticed that URL is now password protected. The concept from the author is simple: use EMA and SMA smoothing of the VIX as two signal lines. When they cross you have a change in VIX direction. I simply coded that for SPYIX which is a slightly different (but theoretically similar) index vs VIX. SPYIX provides intraday updates without a subscription so this indicator can be used for intraday tracking.
開源腳本
本著TradingView的真正精神,此腳本的創建者將其開源,以便交易者可以查看和驗證其功能。向作者致敬!雖然您可以免費使用它,但請記住,重新發佈程式碼必須遵守我們的網站規則。
免責聲明
這些資訊和出版物並不意味著也不構成TradingView提供或認可的金融、投資、交易或其他類型的意見或建議。請在使用條款閱讀更多資訊。
免責聲明
這些資訊和出版物並不意味著也不構成TradingView提供或認可的金融、投資、交易或其他類型的意見或建議。請在使用條款閱讀更多資訊。