PROTECTED SOURCE SCRIPT
Keltner Platform
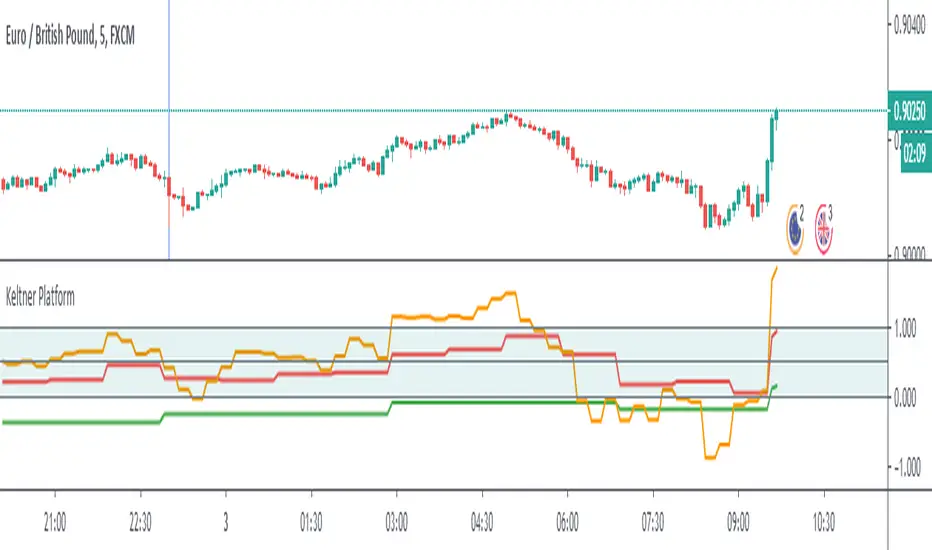
This script gives you the information on Keltner Channels in three or four different timeframes. I usually like to put the information from high-timeframe charts on the lower ones to see the bigger picture without switching. Keltner Platform gives you the idea of how far the price is from its moving average in the true range units.
BLACK - daily
GREEN - 4h
RED - 1h
ORANGE - 15 m if the timeframe is below 1h
How to remember colours? Black is ground, green are plants growing on it, red is the flame, orange is lower temperature flame. This is how they should be settled when all timeframes are in an early uptrend.
You can use different MA types for calculation, simple is recommended (by me).
Have a great trade!
受保護腳本
此腳本以閉源形式發佈。 不過,您可以自由使用,沒有任何限制 — 點擊此處了解更多。
免責聲明
這些資訊和出版物並非旨在提供,也不構成TradingView提供或認可的任何形式的財務、投資、交易或其他類型的建議或推薦。請閱讀使用條款以了解更多資訊。
受保護腳本
此腳本以閉源形式發佈。 不過,您可以自由使用,沒有任何限制 — 點擊此處了解更多。
免責聲明
這些資訊和出版物並非旨在提供,也不構成TradingView提供或認可的任何形式的財務、投資、交易或其他類型的建議或推薦。請閱讀使用條款以了解更多資訊。