INVITE-ONLY SCRIPT
Waves + ZOOnes TimeFrame
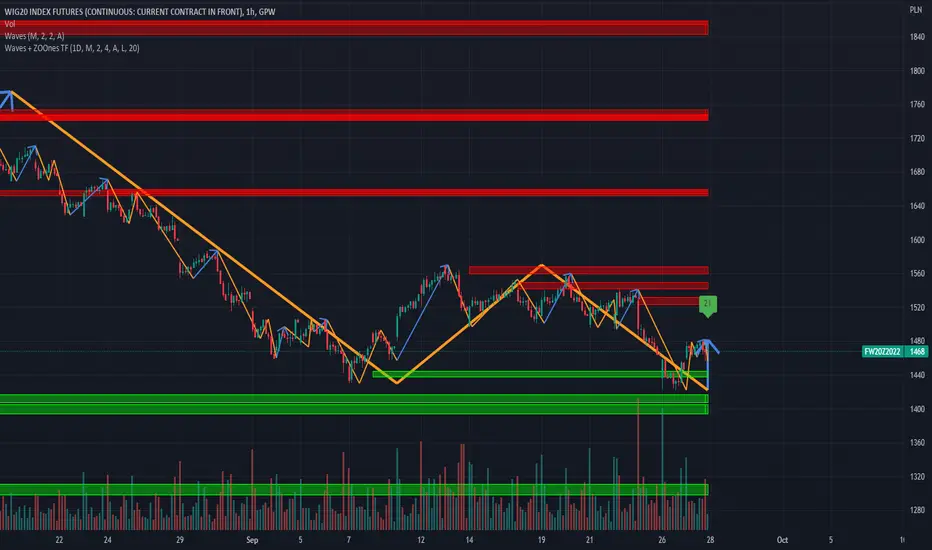
Trend visualization tool in Wave theory. Unlike Elliot waves, it has a constant pattern length. The formation consists of impulse and 3 corrections.
The script analyzes candle relationships in the currect trend, trend will be continueted until candle are not breaking trend rules.
Currently it supports 2 rulesets/wave variants:
Low - More sensitive (trend will change more ofter).
Meddium - Less sensitive ( trend will change less ofter).
Simultaneous observation of both types allows to detect consolidation before the overlapping movement and increase the probability of indicating the moment of the movement occurrence.
Script with limited access, contact author to get authorization
Features:
- Allow to pick timeframe used for visualization.
- Show Low and Middle type/order waves
- Show support/resistance areas for the Low and Middle type/order waves.
- Types for waves and support areas are picked independently. Script can show Middle Waves with Low Waves support areas.
- Shadow mode that show second wave moved to the wave max/min bars.
- Show historical support/resistance areas that are not valid any more.
Script settings:
Timeframe - Time frame used for visualization. It should be less precise or equal as the chart one. e.g. it can show 1D visualization over 1H chart.
TREND VISUALIZATION
Type - Kind of waves should be drawn.
Confirmation - Showing confirmation lavel over current bar If wave direction will not change on this bar
Shadow - Showing second reprezentation of the trend with drawing with the use of minimal and maximal values. It's usefull to determine the delay between the peak and a wave change signal.
Line width - Width of drawn line. Separate setting for Low and Medium trend type.
Color - Color of drawn line. Separate settings for Low and Medium trend type.
Change trend signals - Showing places where alerts are generated (debug feature).
IMPULS VISUALIZATION
Impuls - Picking graphical reprezentation of first bullish arrow.
Color - Color of the first bullish arrow.
Draw arrow - Turning on/off drawing arrow at the end of the impuls wave.
ZOONES
ZOOnes type - Determines what type of trend is used to designate areas of support.
The script analyzes candle relationships in the currect trend, trend will be continueted until candle are not breaking trend rules.
Currently it supports 2 rulesets/wave variants:
Low - More sensitive (trend will change more ofter).
Meddium - Less sensitive ( trend will change less ofter).
Simultaneous observation of both types allows to detect consolidation before the overlapping movement and increase the probability of indicating the moment of the movement occurrence.
Script with limited access, contact author to get authorization
Features:
- Allow to pick timeframe used for visualization.
- Show Low and Middle type/order waves
- Show support/resistance areas for the Low and Middle type/order waves.
- Types for waves and support areas are picked independently. Script can show Middle Waves with Low Waves support areas.
- Shadow mode that show second wave moved to the wave max/min bars.
- Show historical support/resistance areas that are not valid any more.
Script settings:
Timeframe - Time frame used for visualization. It should be less precise or equal as the chart one. e.g. it can show 1D visualization over 1H chart.
TREND VISUALIZATION
Type - Kind of waves should be drawn.
- H(idden) - Do not draw any waves.
- L(low) - Draw low waves
- M(edium) - Draw medium waves
- B(oth) - Draw both low and medium waves
Confirmation - Showing confirmation lavel over current bar If wave direction will not change on this bar
Shadow - Showing second reprezentation of the trend with drawing with the use of minimal and maximal values. It's usefull to determine the delay between the peak and a wave change signal.
Line width - Width of drawn line. Separate setting for Low and Medium trend type.
Color - Color of drawn line. Separate settings for Low and Medium trend type.
Change trend signals - Showing places where alerts are generated (debug feature).
- u - trend change to UP
- d - trend change to DOWN
- U - trand change to UP from the zone
- D - trand change to down from the zone
IMPULS VISUALIZATION
Impuls - Picking graphical reprezentation of first bullish arrow.
- H - Hidden
- F - First
- S - Second
- A - Auto
Color - Color of the first bullish arrow.
Draw arrow - Turning on/off drawing arrow at the end of the impuls wave.
ZOONES
ZOOnes type - Determines what type of trend is used to designate areas of support.
- D - Disabled
- L - Low
- M - Medium
Only nearest zones - Drawing only one nearest zone above and below current price.
Only nearest potencial zones - Drawing only one nearest potencial zone above and below current price.
Resistance - Set of colors (resistance zone background, resistance zone border, potencial resistance zone background, potencial resistance zone border) used for drawing resistance zones and potencial resistance zones.
Support - Set of colors (support zone background, support zone border, potencial support zone background, potencial support zone border) used for drawing support zones and potencial support zones
Show history - Showing zones in historical data
Show fake potencials - Showing historical potencial zonnes that were rejected (debug purpose).
Double count - Treated support and resistance zoones as one zoone
Zone precision - Determines how many bars are included in area calculation.
Alerts:
Low trend DOWN - When Low trend type is changing from UP to DOWN
Low trend UP - When Low trend type is changing from DOWN to UP
middle trend DOWN - When Middle trend type is changing from UP to DOWN
middle trend UP - When Middle trend type is changing from DOWN to UP
middle trend from ZOOnes DOWN - When Middle trend type is changing from UP to DOWN after hiting resistance area .
middle trend from ZOOnes UP = When Middle trend type is changing from DOWN to UP after hiting support area .
Troubleshooting:
In case of any problems, send error details to the author of the script.
僅限邀請腳本
只有經作者授權的使用者才能訪問此腳本,且通常需付費。您可以將此腳本加入收藏,但需先向作者申請並獲得許可後才能使用 — 點擊此處了解更多。如需更多詳情,請依照作者說明或直接聯繫Investor_R。
除非您完全信任其作者並了解腳本的工作原理,否則TradingView不建議您付費或使用腳本。您也可以在我們的社群腳本中找到免費的開源替代方案。
作者的說明
To get access or report problem write on traidingtools@gmail.com
提醒:在請求訪問權限之前,請閱讀僅限邀請腳本指南。
To get access or report problem write on toolkit4trading@proton.me
More details on Website and Youtube.
More details on Website and Youtube.
免責聲明
這些資訊和出版物並不意味著也不構成TradingView提供或認可的金融、投資、交易或其他類型的意見或建議。請在使用條款閱讀更多資訊。