OPEN-SOURCE SCRIPT
已更新 Intraday Super Sectors
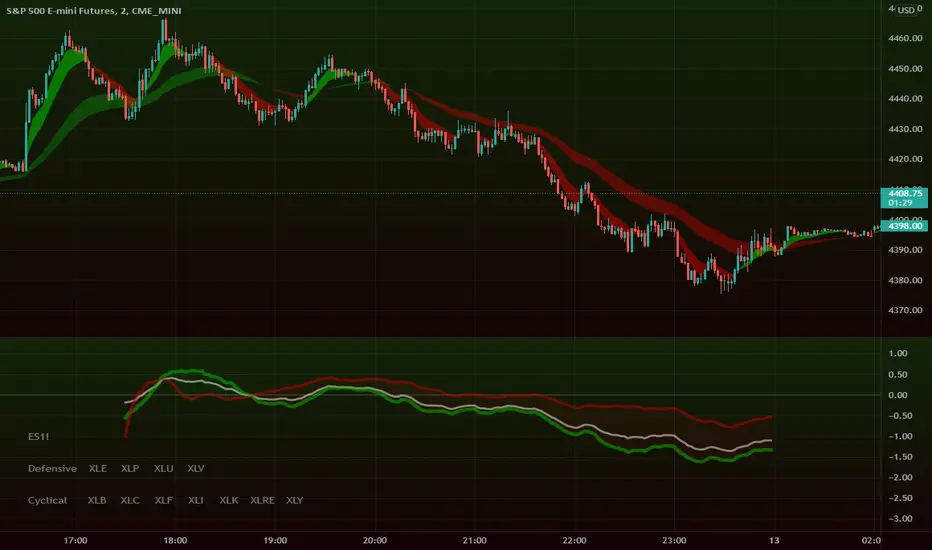
Motivated by Cody to finish what I'd started ...
This indicator plots the two 'Super Sectors' (Cyclical and Defensive) intraday change, viz-a-viz SPX price
* for convenience, it uses the ETF's, rather than the actual sectors. This might make it 0.0001% inaccurate.
For reference:
Defensive Sectors:
XLE Energy (not always considered a true defensive sector, but I've thrown it in here for balance)
XLP Consumer Staples
XLU Utilities
XLV Health Care
Cyclical Sectors:
XLB Materials
XLC Communication Services
XLF Financials
XLI Industrials
XLK Information Technology
XLRE Real Estate
XLY Consumer Discretionary
Why the (soft) red/green cloud?
Well, the theory says is that if the Cyclical Sector is down, while the Defensive Sector is up, this isn't exactly bullish (so a soft red cloud), or if Defensive Stocks are down, while Cyclical Stocks are up, this is perhaps bullish.
Of course, if SPX is down 10%, with Defensive Stocks down 20%, and Cyclical Stocks down 5%, you might get a green cloud, but it ain't exactly a bullish sign
發行說明
New Features!* User can choose whether a sector is 'Cyclical' or 'Defensive'
* User can display spaghetti, if they really want!
Minor Bug Fix
* Small (display-related only) value fix
發行說明
Updated to cater for main charts that show trading hours outside the regular cash session (e.g. ES1!)If you're just displaying SPX, no need to change these sessions
If you're displaying extended hours, please change the settings:
a) 'Extended Hours'
b) Is it Summer Time (daylight savings) or Winter Time?
Outside of the cash session, the indicator is dormant (don't worry - it'll come to life at 09:30!)
開源腳本
本著TradingView的真正精神,此腳本的創建者將其開源,以便交易者可以查看和驗證其功能。向作者致敬!雖然您可以免費使用它,但請記住,重新發佈程式碼必須遵守我們的網站規則。
免責聲明
這些資訊和出版物並不意味著也不構成TradingView提供或認可的金融、投資、交易或其他類型的意見或建議。請在使用條款閱讀更多資訊。
開源腳本
本著TradingView的真正精神,此腳本的創建者將其開源,以便交易者可以查看和驗證其功能。向作者致敬!雖然您可以免費使用它,但請記住,重新發佈程式碼必須遵守我們的網站規則。
免責聲明
這些資訊和出版物並不意味著也不構成TradingView提供或認可的金融、投資、交易或其他類型的意見或建議。請在使用條款閱讀更多資訊。