OPEN-SOURCE SCRIPT
probability_of_touch
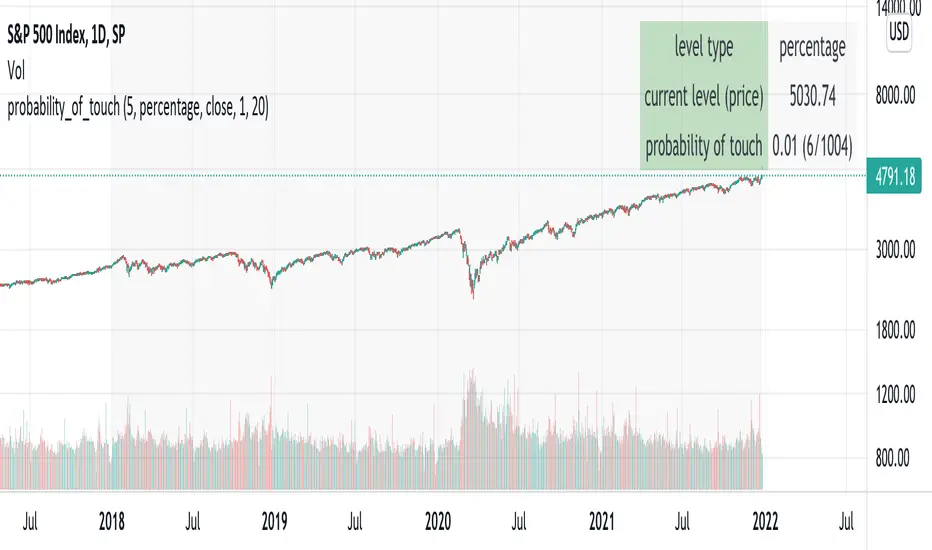
Based on historical data (rather than theory), calculates the probability of a price level being "touched" within a given time frame. A "touch" means that price exceeded that level at some point. The parameters are:
- level: the "level" to be touched. it can be a number of points, percentage points, or standard deviations away from the mark price. a positive level is above the mark price, and a negative level is below the mark price.
- type: determines the meaning of the "level" parameter. "price" means price points (i.e. the numbers you see on the chart). "percentage" is expressed as a whole number, not a fraction. "stdev" means number of standard deviations, which is computed from recent realized volatlity.
- mark: the point from which the "level" is measured.
- length: the number of days within which the level must be touched.
- window: the number of days used to compute realized volatility. this parameter is only used when "type" is "stdev".
- debug: displays a fuchsia "X" over periods that touched the level. note that only a limited number of labels can be drawn.
- start: only include data after this time in the calculation.
- end: only include data before this time in the calculation.
Example: You want to know how many times Apple stock fell $1 from its closing price the next day, between 2020-02-26 and today. Use the following parameters:
level: -1
type: price
mark: close
length: 1
window: [NA]
debug: [NA]
start: 2020-02-26
end: [default]
How does the script work? On every bar, the script looks back "length" days and sees if any day exceeded the "mark" price from "length" days ago, plus the limit. The probability is the ratio of such periods wherein price exceeded the limit to the total number of periods.
開源腳本
本著TradingView的真正精神,此腳本的創建者將其開源,以便交易者可以查看和驗證其功能。向作者致敬!雖然您可以免費使用它,但請記住,重新發佈程式碼必須遵守我們的網站規則。
免責聲明
這些資訊和出版物並不意味著也不構成TradingView提供或認可的金融、投資、交易或其他類型的意見或建議。請在使用條款閱讀更多資訊。
開源腳本
本著TradingView的真正精神,此腳本的創建者將其開源,以便交易者可以查看和驗證其功能。向作者致敬!雖然您可以免費使用它,但請記住,重新發佈程式碼必須遵守我們的網站規則。
免責聲明
這些資訊和出版物並不意味著也不構成TradingView提供或認可的金融、投資、交易或其他類型的意見或建議。請在使用條款閱讀更多資訊。