OPEN-SOURCE SCRIPT
Volume Weighted Standard Deviation (VWSD)
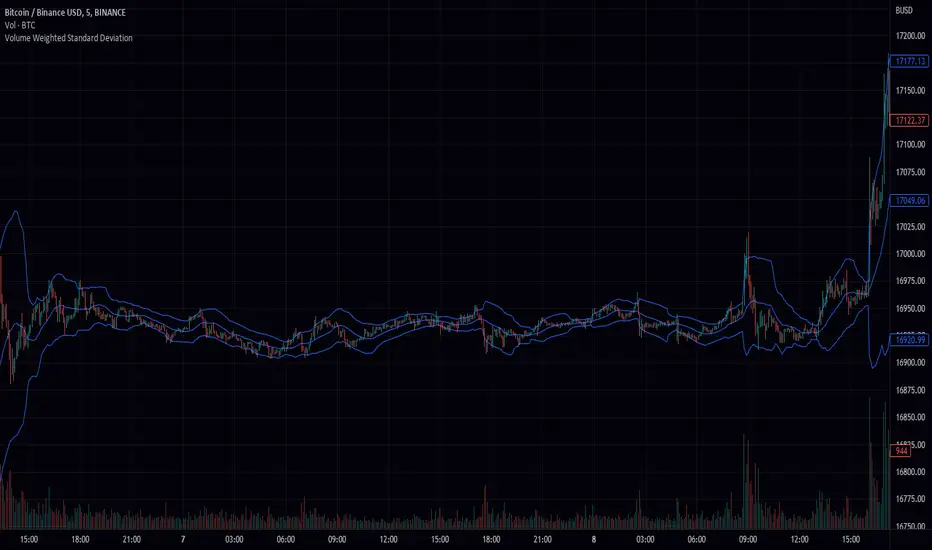
The Volume Weighted Standard Deviation indicator is a custom technical analysis tool that uses the volume of trading to calculate the standard deviation of a stock's price. This indicator takes the source of data, the length of data, and the deviation as inputs, and calculates the volume weighted standard deviation using the values.
The indicator first calculates the mean price and mean volume by using simple moving average over the given length of data. Then it calculates the squared difference between the mean price and the actual price, multiplied by the volume. This gives a volume-weighted squared difference. The indicator then calculates the square root of the sum of the volume-weighted squared differences divided by the sum of the volumes over the given length of data. This gives the volume weighted standard deviation.
The indicator then plots the standard deviation and deviation as a band around the simple moving average of the source data, providing a clear view of the volatility of the stock.
In summary, the Volume Weighted Standard Deviation indicator is a powerful tool for measuring the volatility of a stock by taking into account the volume of trading. It uses the volume of trading to calculate the standard deviation of a stock's price, giving a more accurate representation of the volatility of the stock. It can be useful for traders to identify entry and exit points and make more informed trading decisions.
開源腳本
秉持TradingView一貫精神,這個腳本的創作者將其設為開源,以便交易者檢視並驗證其功能。向作者致敬!您可以免費使用此腳本,但請注意,重新發佈代碼需遵守我們的社群規範。
免責聲明
這些資訊和出版物並非旨在提供,也不構成TradingView提供或認可的任何形式的財務、投資、交易或其他類型的建議或推薦。請閱讀使用條款以了解更多資訊。
開源腳本
秉持TradingView一貫精神,這個腳本的創作者將其設為開源,以便交易者檢視並驗證其功能。向作者致敬!您可以免費使用此腳本,但請注意,重新發佈代碼需遵守我們的社群規範。
免責聲明
這些資訊和出版物並非旨在提供,也不構成TradingView提供或認可的任何形式的財務、投資、交易或其他類型的建議或推薦。請閱讀使用條款以了解更多資訊。