OPEN-SOURCE SCRIPT
已更新 Wick Percentages Table
This script is designed to calculate and display the percentage representation of wick lengths in relation to the total candle range for the last 100 candles on a trading chart. Here's a breakdown of its functionality:
Indicator Initialization: It sets up an indicator named "Wick Percentages Table" (WPT) that overlays on the trading chart.
Variables Initialization: The script initializes variables to store the total lengths of top wicks, bottom wicks, and the total ranges for the last 100 candles.
Wick and Range Calculations: For the past 100 candles, it calculates:
The length of the top wick (the distance between the high and the higher of the open or close).
The length of the bottom wick (the distance between the low and the lower of the open or close).
The total range of each candle (the distance between the high and the low).
Percentage Calculations: It computes the top and bottom wick lengths as percentages of the total candle range across the last 100 candles.
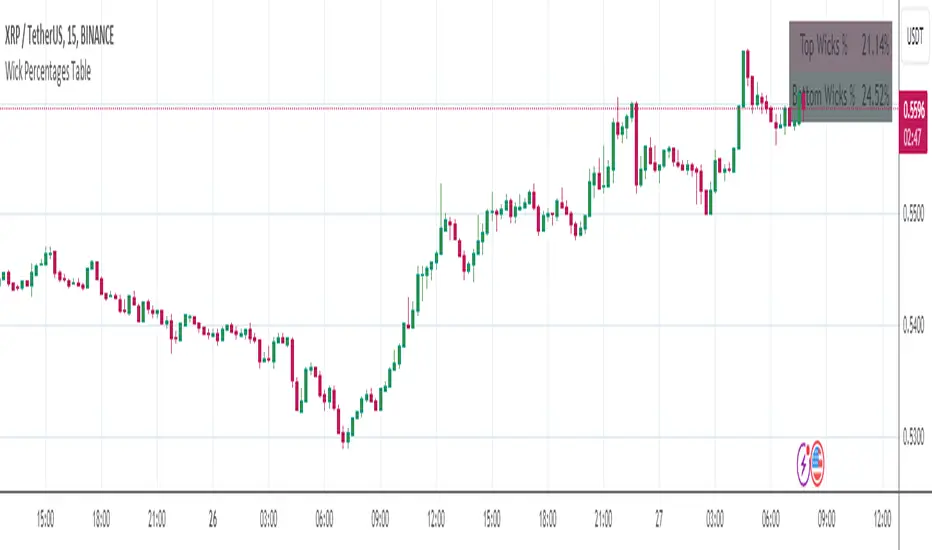
Table Display: It creates or updates a table displayed on the top right of the chart showing these percentages. The table has two rows: one for the "Top Wick %" and another for the "Bottom Wick %", with the corresponding percentages calculated and displayed.
Visibility Maintenance: It plots a dummy variable to ensure the indicator's visibility on the chart.
The purpose of this script is to provide traders with a visual representation of the wick lengths as percentages, offering insights into market behavior and potential price movements based on recent candlestick patterns. It aids in assessing market volatility and trader sentiment through the analysis of wick lengths relative to the total candle sizes.
...
Any improvements to this code would be more then welcome.
I was getting an error in line 30, the only thing I could find was to comment it out.
Indicator Initialization: It sets up an indicator named "Wick Percentages Table" (WPT) that overlays on the trading chart.
Variables Initialization: The script initializes variables to store the total lengths of top wicks, bottom wicks, and the total ranges for the last 100 candles.
Wick and Range Calculations: For the past 100 candles, it calculates:
The length of the top wick (the distance between the high and the higher of the open or close).
The length of the bottom wick (the distance between the low and the lower of the open or close).
The total range of each candle (the distance between the high and the low).
Percentage Calculations: It computes the top and bottom wick lengths as percentages of the total candle range across the last 100 candles.
Table Display: It creates or updates a table displayed on the top right of the chart showing these percentages. The table has two rows: one for the "Top Wick %" and another for the "Bottom Wick %", with the corresponding percentages calculated and displayed.
Visibility Maintenance: It plots a dummy variable to ensure the indicator's visibility on the chart.
The purpose of this script is to provide traders with a visual representation of the wick lengths as percentages, offering insights into market behavior and potential price movements based on recent candlestick patterns. It aids in assessing market volatility and trader sentiment through the analysis of wick lengths relative to the total candle sizes.
...
Any improvements to this code would be more then welcome.
I was getting an error in line 30, the only thing I could find was to comment it out.
發行說明
minor modifications開源腳本
秉持TradingView一貫精神,這個腳本的創作者將其設為開源,以便交易者檢視並驗證其功能。向作者致敬!您可以免費使用此腳本,但請注意,重新發佈代碼需遵守我們的社群規範。
免責聲明
這些資訊和出版物並非旨在提供,也不構成TradingView提供或認可的任何形式的財務、投資、交易或其他類型的建議或推薦。請閱讀使用條款以了解更多資訊。
免責聲明
這些資訊和出版物並非旨在提供,也不構成TradingView提供或認可的任何形式的財務、投資、交易或其他類型的建議或推薦。請閱讀使用條款以了解更多資訊。