OPEN-SOURCE SCRIPT
已更新 Fibonacci Time Periods
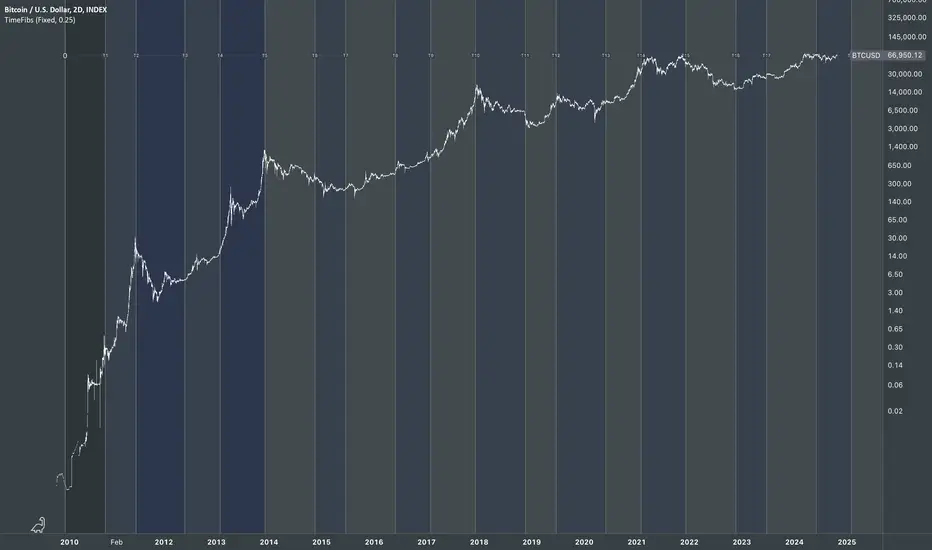
The "Fibonacci Time Periods" indicator uses power exponents of the constant Phi based on your custom time period to generate Fibonacci sequence-based progression on a given chart. This tool can help to anticipate the timing of potential turning points by highlighting Fib time zones where significant price movements may occur.
It is different from other alternatives specifically for the ability to alter the rate of progression.
Most famous regular Fib sequence expands with 1.618^(n+1) rate which produces vast change just after few iterations.

Those ever-expanding big intervals don't allow us to cover the smaller details of the chart which we might find crucial. So, the idea was born to break down the constant Phi to a self-fraction using power exponents. In other words, reducing rate of progression to make the expansion more gradual without losing properties of Fibonacci proportions.
Default settings have a rate of 0.25 which is basically Phi^1/4
That means we expect 4x more lines than in regular sequence to cover missing bits owing to formula: 1.618^(0.25*(n+1))

(Line 0.618 is added to enhance visual orientation and perception of proportions)
How it works:
Exponential rate of progression
If we change the rate to 1 it will produce the regular fib sequence with 1.618^(n+1) rate

Fixed rate of progression:
In this mode, when rate is 0.25, it grows exactly with exponent step of 0.25 so first, second, third, etc generated lines also have the fixed exponent of 0.25. The distance between lines do not expand.

How to use:
It is different from other alternatives specifically for the ability to alter the rate of progression.
Most famous regular Fib sequence expands with 1.618^(n+1) rate which produces vast change just after few iterations.
Those ever-expanding big intervals don't allow us to cover the smaller details of the chart which we might find crucial. So, the idea was born to break down the constant Phi to a self-fraction using power exponents. In other words, reducing rate of progression to make the expansion more gradual without losing properties of Fibonacci proportions.
Default settings have a rate of 0.25 which is basically Phi^1/4
That means we expect 4x more lines than in regular sequence to cover missing bits owing to formula: 1.618^(0.25*(n+1))
(Line 0.618 is added to enhance visual orientation and perception of proportions)
How it works:
Exponential rate of progression
- First, it works out the difference between your custom start (0) and end (1) period
- The result is multiplied by 1.618^rate to get the step
- Rest lines are created by iterations. For instance, with default rate of 0.25, the 1st generated line = start + (End-Start)*1.618^0.25*1, second line = start + (End-Start)*1.618^0.25*2, etc.
If we change the rate to 1 it will produce the regular fib sequence with 1.618^(n+1) rate
Fixed rate of progression:
In this mode, when rate is 0.25, it grows exactly with exponent step of 0.25 so first, second, third, etc generated lines also have the fixed exponent of 0.25. The distance between lines do not expand.
How to use:
- Set the start and end dates
- Choose the type of progression
- Choose your desired rate of progression
- Customize the colors to match your chart preferences.
- Observe the generated Fibonacci time intervals and use them to identify potential market movements and reactions.
發行說明
Fundamental change to the formula of "Fixed Progression": Basically the fib proportions are anchored to base distance, so that after 1 it goes 1.236, 1.382.. - makes the ratios repeat from 0;1. This allows to factor in very important cyclicality property in predictive properties. I've always used repetitive fibonacci ratios when I worked with fractals.開源腳本
秉持TradingView一貫精神,這個腳本的創作者將其設為開源,以便交易者檢視並驗證其功能。向作者致敬!您可以免費使用此腳本,但請注意,重新發佈代碼需遵守我們的社群規範。
Unlock exclusive tools: fractlab.com
ᴀʟʟ ᴄᴏɴᴛᴇɴᴛ ᴘʀᴏᴠɪᴅᴇᴅ ʙʏ ꜰʀᴀᴄᴛʟᴀʙ ɪꜱ ɪɴᴛᴇɴᴅᴇᴅ ꜰᴏʀ ɪɴꜰᴏʀᴍᴀᴛɪᴏɴᴀʟ ᴀɴᴅ ᴇᴅᴜᴄᴀᴛɪᴏɴᴀʟ ᴘᴜʀᴘᴏꜱᴇꜱ ᴏɴʟʏ.
ᴘᴀꜱᴛ ᴘᴇʀꜰᴏʀᴍᴀɴᴄᴇ ɪꜱ ɴᴏᴛ ɪɴᴅɪᴄᴀᴛɪᴠᴇ ᴏꜰ ꜰᴜᴛᴜʀᴇ ʀᴇꜱᴜʟᴛꜱ.
ᴀʟʟ ᴄᴏɴᴛᴇɴᴛ ᴘʀᴏᴠɪᴅᴇᴅ ʙʏ ꜰʀᴀᴄᴛʟᴀʙ ɪꜱ ɪɴᴛᴇɴᴅᴇᴅ ꜰᴏʀ ɪɴꜰᴏʀᴍᴀᴛɪᴏɴᴀʟ ᴀɴᴅ ᴇᴅᴜᴄᴀᴛɪᴏɴᴀʟ ᴘᴜʀᴘᴏꜱᴇꜱ ᴏɴʟʏ.
ᴘᴀꜱᴛ ᴘᴇʀꜰᴏʀᴍᴀɴᴄᴇ ɪꜱ ɴᴏᴛ ɪɴᴅɪᴄᴀᴛɪᴠᴇ ᴏꜰ ꜰᴜᴛᴜʀᴇ ʀᴇꜱᴜʟᴛꜱ.
免責聲明
這些資訊和出版物並非旨在提供,也不構成TradingView提供或認可的任何形式的財務、投資、交易或其他類型的建議或推薦。請閱讀使用條款以了解更多資訊。
開源腳本
秉持TradingView一貫精神,這個腳本的創作者將其設為開源,以便交易者檢視並驗證其功能。向作者致敬!您可以免費使用此腳本,但請注意,重新發佈代碼需遵守我們的社群規範。
Unlock exclusive tools: fractlab.com
ᴀʟʟ ᴄᴏɴᴛᴇɴᴛ ᴘʀᴏᴠɪᴅᴇᴅ ʙʏ ꜰʀᴀᴄᴛʟᴀʙ ɪꜱ ɪɴᴛᴇɴᴅᴇᴅ ꜰᴏʀ ɪɴꜰᴏʀᴍᴀᴛɪᴏɴᴀʟ ᴀɴᴅ ᴇᴅᴜᴄᴀᴛɪᴏɴᴀʟ ᴘᴜʀᴘᴏꜱᴇꜱ ᴏɴʟʏ.
ᴘᴀꜱᴛ ᴘᴇʀꜰᴏʀᴍᴀɴᴄᴇ ɪꜱ ɴᴏᴛ ɪɴᴅɪᴄᴀᴛɪᴠᴇ ᴏꜰ ꜰᴜᴛᴜʀᴇ ʀᴇꜱᴜʟᴛꜱ.
ᴀʟʟ ᴄᴏɴᴛᴇɴᴛ ᴘʀᴏᴠɪᴅᴇᴅ ʙʏ ꜰʀᴀᴄᴛʟᴀʙ ɪꜱ ɪɴᴛᴇɴᴅᴇᴅ ꜰᴏʀ ɪɴꜰᴏʀᴍᴀᴛɪᴏɴᴀʟ ᴀɴᴅ ᴇᴅᴜᴄᴀᴛɪᴏɴᴀʟ ᴘᴜʀᴘᴏꜱᴇꜱ ᴏɴʟʏ.
ᴘᴀꜱᴛ ᴘᴇʀꜰᴏʀᴍᴀɴᴄᴇ ɪꜱ ɴᴏᴛ ɪɴᴅɪᴄᴀᴛɪᴠᴇ ᴏꜰ ꜰᴜᴛᴜʀᴇ ʀᴇꜱᴜʟᴛꜱ.
免責聲明
這些資訊和出版物並非旨在提供,也不構成TradingView提供或認可的任何形式的財務、投資、交易或其他類型的建議或推薦。請閱讀使用條款以了解更多資訊。