INVITE-ONLY SCRIPT
已更新 Indikatoren-Schmied - Was-Wäre-Wenn - Scanner
The observatory for options traders
Look even deeper into the vastness of options space.
A look into the far reaches of space is like a journey into the past. This what-if indicator with the observatory uses the same logic and provides you with simulated historical results of option trades.
You can test different filter groups or constellations and gradually refine and improve the results.
The filter functions and the logic of the drawdown are identical to those of the traditional what-if indicator. The backtest can be set up up to the year 2007.
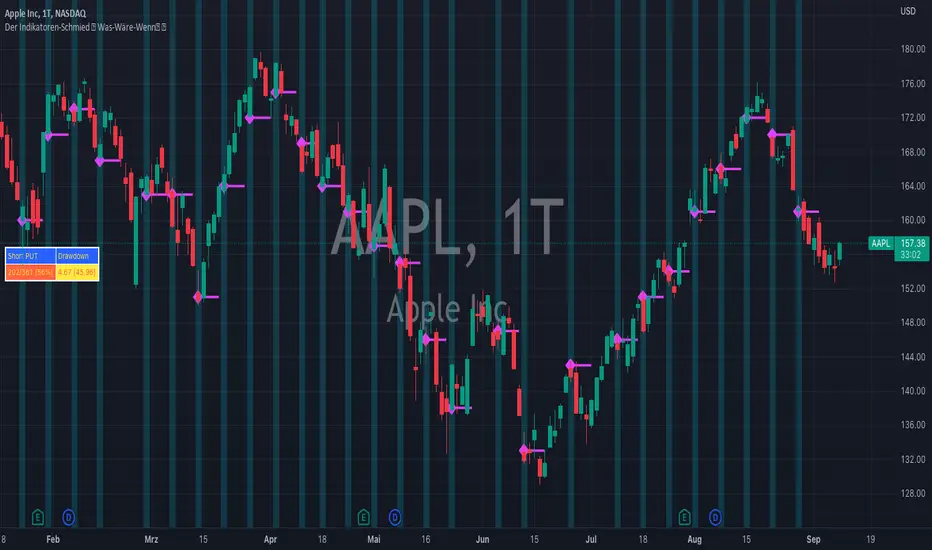
Depending on the filter constellation, the table shows you the number of trades over the selected period and how many of them were winners. The win rate in percent is shown in brackets.
The table shows a maximum of 30 filter constellations.
In the indicator settings, I recommend clicking on the "Only show results with a high win rate" field in the backtest area. This will only display the filter constellations in the results table that have a higher win rate than if all filters were set to "Off".
The colors in the "Short Put" column are to be understood as follows:
The background color becomes "greener" as the win rate approaches 100%.
It becomes "redder" the lower this win rate falls.
The numbers themselves are displayed in yellow if the total number of trades has been reduced by a maximum of 25% when filters have been applied (compared to the constellation without filters). The constellation without filters is also displayed with yellow numbers.
The numbers are displayed in white if the total number of trades was reduced by a maximum of 50% when filters were applied (compared to the constellation without filters).
If the numbers appear in brown, the filters are so strict that more than half of all trades are eliminated compared to a configuration with all filters set to "Off".
Please note that although an improvement in the win rate through strict filters is desirable, this can lead to a drastic reduction in the number of trades.
Test different filters, entries and exits in order to set up a sensible strategy.
Always remember that these are approximations. Real trading will always deviate from this theoretical backtest.
To the question "What if?", this indicator also provides the following answer: It would be "roughly" like this...
Visit us: Tradehelden!
========
Die Sternwarte für Optionshändler
Blicken Sie noch tiefer in die Weite des Options-Weltraums.
Ein Blick in die Fernen des Weltalls ist wie eine Reise in die Vergangenheit. Dieser Was-Wäre-Wenn Indikator mit der Sternwarte bedient sich derselben Logik und liefert Ihnen simulierte historische Ergebnisse von Optionstrades.
Sie können verschiedene Filter-Gruppen bzw. -Konstellationen testen und die Ergebnisse schrittweise verfeinern und verbessern.
Die Filter-Funktionen und die Logik des Drawdowns sind identisch mit denen des traditionellen Was-Wäre-Wenn-Indikators. Der Backtest kann bis ins Jahr 2007 aufgesetzt werden.
Die Tabelle zeigt Ihnen, je nach Filter-Konstellation, die Anzahl der Trades über den gewählten Zeitraum, und wie viele davon Gewinner waren. Die Gewinnrate in Prozent wird in den Klammern dargestellt.
Die Tabelle zeigt maximal 30 Filter-Konstellationen.
In den Einstellungen des Indikators empfehle ich, das Feld „Zeige nur Ergebnisse mit hoher Gewinnrate“ im Backtest-Bereich anzuklicken. Dadurch werden nur die Filter-Konstellationen in der Ergebnis-Tabelle angezeigt, die eine höhere Gewinnrate aufweisen als wenn alle Filter auf „Off“ wären.
Die Farben in der Spalte „Short Put“ sind wie folgt zu verstehen:
Die Hintergrundfarbe wird „grüner“, wenn sich die Gewinnrate 100% nähert.
Sie wird „roter“, je tiefer diese Gewinnrate fällt.
Die Zahlen selbst werden gelb dargestellt, sofern die Gesamtanzahl an Trades um maximal 25% reduziert wurde, wenn Filter angewandt wurden (im Vergleich zu der Konstellation ohne Filter). Die Konstellation ohne Filter wird ebenfalls mit gelben Zahlen dargestellt.
Die Zahlen werden weiß dargestellt, wenn die Gesamtanzahl an Trades um maximal 50% reduziert wurde, wenn Filter angewandt wurden (im Vergleich zu der Konstellation ohne Filter).
Erscheinen die Zahlen in braun, sind die Filter so streng gewählt, dass mehr als die Hälfte aller Trades eliminiert werden, im Vergleich zu einer Konfiguration mit allen Filtern auf „Off“.
Achten Sie demnach darauf, dass eine Verbesserung der Gewinnrate durch strenge Filter zwar anstrebenswert ist, diese jedoch dazu führen kann, dass die Anzahl der Trades drastisch reduziert wird.
Testen Sie unterschiedliche Filter, Einstiege und Ausstiege, um eine sinnvolle Strategie aufzusetzen.
Bedenken Sie immer, dass es sich hier um Annäherungen handelt. Der reale Handel wird immer von diesem theoretischen Backtest abweichen.
Auf die Frage „Was wäre, wenn?“ liefert auch dieser Indikator dementsprechend folgende Antwort: Es wäre „in etwa“ so…
Besuchen Sie uns: Tradehelden!
Look even deeper into the vastness of options space.
A look into the far reaches of space is like a journey into the past. This what-if indicator with the observatory uses the same logic and provides you with simulated historical results of option trades.
You can test different filter groups or constellations and gradually refine and improve the results.
The filter functions and the logic of the drawdown are identical to those of the traditional what-if indicator. The backtest can be set up up to the year 2007.
Depending on the filter constellation, the table shows you the number of trades over the selected period and how many of them were winners. The win rate in percent is shown in brackets.
The table shows a maximum of 30 filter constellations.
In the indicator settings, I recommend clicking on the "Only show results with a high win rate" field in the backtest area. This will only display the filter constellations in the results table that have a higher win rate than if all filters were set to "Off".
The colors in the "Short Put" column are to be understood as follows:
The background color becomes "greener" as the win rate approaches 100%.
It becomes "redder" the lower this win rate falls.
The numbers themselves are displayed in yellow if the total number of trades has been reduced by a maximum of 25% when filters have been applied (compared to the constellation without filters). The constellation without filters is also displayed with yellow numbers.
The numbers are displayed in white if the total number of trades was reduced by a maximum of 50% when filters were applied (compared to the constellation without filters).
If the numbers appear in brown, the filters are so strict that more than half of all trades are eliminated compared to a configuration with all filters set to "Off".
Please note that although an improvement in the win rate through strict filters is desirable, this can lead to a drastic reduction in the number of trades.
Test different filters, entries and exits in order to set up a sensible strategy.
Always remember that these are approximations. Real trading will always deviate from this theoretical backtest.
To the question "What if?", this indicator also provides the following answer: It would be "roughly" like this...
Visit us: Tradehelden!
========
Die Sternwarte für Optionshändler
Blicken Sie noch tiefer in die Weite des Options-Weltraums.
Ein Blick in die Fernen des Weltalls ist wie eine Reise in die Vergangenheit. Dieser Was-Wäre-Wenn Indikator mit der Sternwarte bedient sich derselben Logik und liefert Ihnen simulierte historische Ergebnisse von Optionstrades.
Sie können verschiedene Filter-Gruppen bzw. -Konstellationen testen und die Ergebnisse schrittweise verfeinern und verbessern.
Die Filter-Funktionen und die Logik des Drawdowns sind identisch mit denen des traditionellen Was-Wäre-Wenn-Indikators. Der Backtest kann bis ins Jahr 2007 aufgesetzt werden.
Die Tabelle zeigt Ihnen, je nach Filter-Konstellation, die Anzahl der Trades über den gewählten Zeitraum, und wie viele davon Gewinner waren. Die Gewinnrate in Prozent wird in den Klammern dargestellt.
Die Tabelle zeigt maximal 30 Filter-Konstellationen.
In den Einstellungen des Indikators empfehle ich, das Feld „Zeige nur Ergebnisse mit hoher Gewinnrate“ im Backtest-Bereich anzuklicken. Dadurch werden nur die Filter-Konstellationen in der Ergebnis-Tabelle angezeigt, die eine höhere Gewinnrate aufweisen als wenn alle Filter auf „Off“ wären.
Die Farben in der Spalte „Short Put“ sind wie folgt zu verstehen:
Die Hintergrundfarbe wird „grüner“, wenn sich die Gewinnrate 100% nähert.
Sie wird „roter“, je tiefer diese Gewinnrate fällt.
Die Zahlen selbst werden gelb dargestellt, sofern die Gesamtanzahl an Trades um maximal 25% reduziert wurde, wenn Filter angewandt wurden (im Vergleich zu der Konstellation ohne Filter). Die Konstellation ohne Filter wird ebenfalls mit gelben Zahlen dargestellt.
Die Zahlen werden weiß dargestellt, wenn die Gesamtanzahl an Trades um maximal 50% reduziert wurde, wenn Filter angewandt wurden (im Vergleich zu der Konstellation ohne Filter).
Erscheinen die Zahlen in braun, sind die Filter so streng gewählt, dass mehr als die Hälfte aller Trades eliminiert werden, im Vergleich zu einer Konfiguration mit allen Filtern auf „Off“.
Achten Sie demnach darauf, dass eine Verbesserung der Gewinnrate durch strenge Filter zwar anstrebenswert ist, diese jedoch dazu führen kann, dass die Anzahl der Trades drastisch reduziert wird.
Testen Sie unterschiedliche Filter, Einstiege und Ausstiege, um eine sinnvolle Strategie aufzusetzen.
Bedenken Sie immer, dass es sich hier um Annäherungen handelt. Der reale Handel wird immer von diesem theoretischen Backtest abweichen.
Auf die Frage „Was wäre, wenn?“ liefert auch dieser Indikator dementsprechend folgende Antwort: Es wäre „in etwa“ so…
Besuchen Sie uns: Tradehelden!
發行說明
Backtest aktualisiert僅限邀請腳本
只有經作者批准的使用者才能訪問此腳本。您需要申請並獲得使用權限。該權限通常在付款後授予。如欲了解更多詳情,請依照以下作者的說明操作,或直接聯絡Tradehelden。
請注意,此私人、僅限邀請的腳本尚未經過腳本管理員審核,其是否符合社群規範尚無定論。 除非您完全信任其作者並了解腳本的工作原理,否則TradingView不建議您付費或使用腳本。您也可以在我們的社群腳本中找到免費的開源替代方案。
作者的說明
Alle Infos zum Zugriff auf diesen Indikator findest du unter https://tradehelden.com
All information on accessing this indicator can be found at https://tradehelden.com
Werde jetzt Mitglied der größten Options-Community im deutschsprachigen Raum: optiontradingpal.com/
Finde alle unsere Indikatoren im Tradehelden-Shop: tradehelden.com/shop
Liebe Grüße,
Thomas
Finde alle unsere Indikatoren im Tradehelden-Shop: tradehelden.com/shop
Liebe Grüße,
Thomas
免責聲明
這些資訊和出版物並不意味著也不構成TradingView提供或認可的金融、投資、交易或其他類型的意見或建議。請在使用條款閱讀更多資訊。
僅限邀請腳本
只有經作者批准的使用者才能訪問此腳本。您需要申請並獲得使用權限。該權限通常在付款後授予。如欲了解更多詳情,請依照以下作者的說明操作,或直接聯絡Tradehelden。
請注意,此私人、僅限邀請的腳本尚未經過腳本管理員審核,其是否符合社群規範尚無定論。 除非您完全信任其作者並了解腳本的工作原理,否則TradingView不建議您付費或使用腳本。您也可以在我們的社群腳本中找到免費的開源替代方案。
作者的說明
Alle Infos zum Zugriff auf diesen Indikator findest du unter https://tradehelden.com
All information on accessing this indicator can be found at https://tradehelden.com
Werde jetzt Mitglied der größten Options-Community im deutschsprachigen Raum: optiontradingpal.com/
Finde alle unsere Indikatoren im Tradehelden-Shop: tradehelden.com/shop
Liebe Grüße,
Thomas
Finde alle unsere Indikatoren im Tradehelden-Shop: tradehelden.com/shop
Liebe Grüße,
Thomas
免責聲明
這些資訊和出版物並不意味著也不構成TradingView提供或認可的金融、投資、交易或其他類型的意見或建議。請在使用條款閱讀更多資訊。