PROTECTED SOURCE SCRIPT
已更新 FCPO - NSawit Swing Strategy
This Indicator implements a custom strategy function in an indicator script. It works on a 4-hour time frame and exclusively for the FCPO futures market only.
The NSawit Swing Strategy consists of three main features:
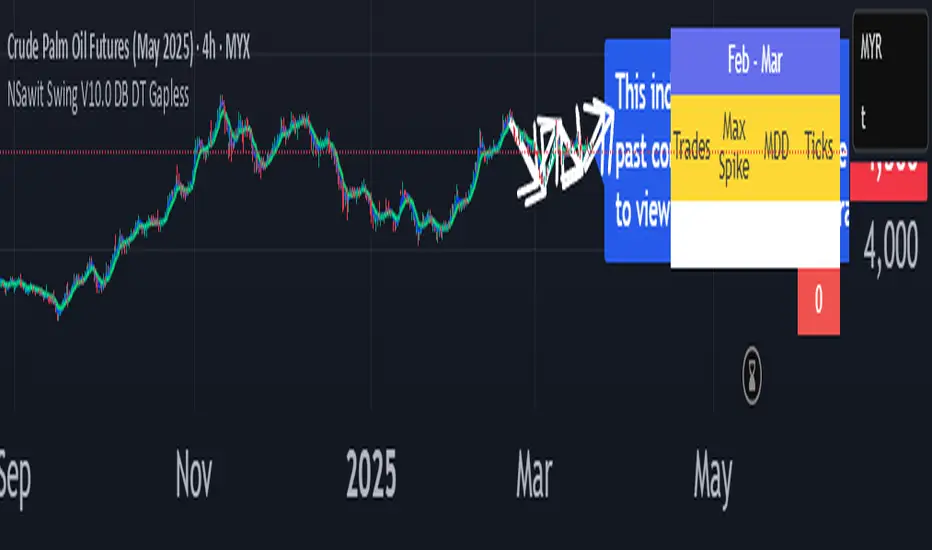
Feature 1: Trade Summary

This feature utilizes the table function to summarize all completed trades within the current active month. The indicator generates a table that displays relevant trade information like total ticks and profit/loss. For example: table.new(position.top_right, 1, 4, border_width=0)
Feature 2: Active Month Highlight

The purpose of this feature is to visually mark the beginning and end of the current active month on the chart. It achieves this by dynamically changing the background color within the current active month. For example: bgcolor(Highlight ? ColorBG : na)
Feature 3: Swing Reversal Points

This feature identifies swing reversal points on the chart by analyzing candlestick patterns and applying a custom matching algorithm.

If a candlestick pattern matches the specified criteria, the indicator generates a retest box area.

When the price touches this box, it triggers long or short orders. The relevant data, including entry and exit points, are stored in sets of arrays. These data are then utilized by the Trade Summary table to provide a comprehensive overview of the swing trading activity.

Take profit and cut loss value can be set in setting.
To view past contracts kindly add this watchlist.
tradingview.com/...atchlists/114756000/
The NSawit Swing Strategy consists of three main features:
Feature 1: Trade Summary
This feature utilizes the table function to summarize all completed trades within the current active month. The indicator generates a table that displays relevant trade information like total ticks and profit/loss. For example: table.new(position.top_right, 1, 4, border_width=0)
Feature 2: Active Month Highlight
The purpose of this feature is to visually mark the beginning and end of the current active month on the chart. It achieves this by dynamically changing the background color within the current active month. For example: bgcolor(Highlight ? ColorBG : na)
Feature 3: Swing Reversal Points
This feature identifies swing reversal points on the chart by analyzing candlestick patterns and applying a custom matching algorithm.
If a candlestick pattern matches the specified criteria, the indicator generates a retest box area.
When the price touches this box, it triggers long or short orders. The relevant data, including entry and exit points, are stored in sets of arrays. These data are then utilized by the Trade Summary table to provide a comprehensive overview of the swing trading activity.
Take profit and cut loss value can be set in setting.
To view past contracts kindly add this watchlist.
tradingview.com/...atchlists/114756000/
發行說明
Fix the settings menu.發行說明
Updated watchlisthttps://www.tradingview.com/watchlists/114756000/
發行說明
Fix tickerID issue發行說明
Remove tickerID label發行說明
* Improve the signal condition.* Restructure summary of trades.
發行說明
Added new pattern profile發行說明
*Improve signal發行說明
Added New Long No 9 & Long No 5.Improve Short No 5 entry point.
發行說明
8.3發行說明
Shows low-risk signal based on gapless calculation.發行說明
Fixed typo All -> All發行說明
CL set 16Implement proper arrays
Implement Risk Type in menu
發行說明
Fix TV tickerID issue發行說明
Last version. The next version will continue with the strategy script.發行說明
Fix a lot of pattern issues.受保護腳本
此腳本以閉源形式發佈。 However, you can use it freely and without any limitations – learn more here.
免責聲明
The information and publications are not meant to be, and do not constitute, financial, investment, trading, or other types of advice or recommendations supplied or endorsed by TradingView. Read more in the Terms of Use.
受保護腳本
此腳本以閉源形式發佈。 However, you can use it freely and without any limitations – learn more here.
免責聲明
The information and publications are not meant to be, and do not constitute, financial, investment, trading, or other types of advice or recommendations supplied or endorsed by TradingView. Read more in the Terms of Use.