OPEN-SOURCE SCRIPT
已更新 Supply and Demand Zones
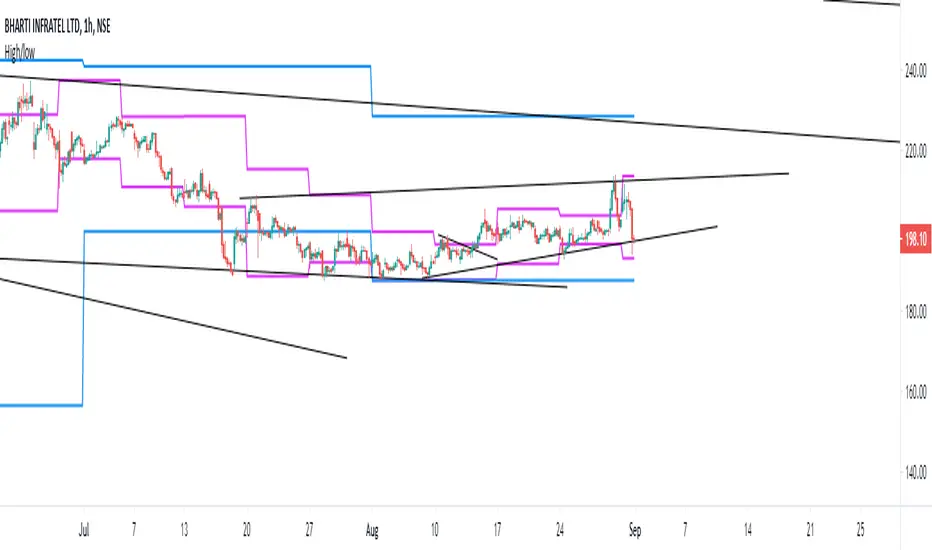
This indicators should be used along with price action breakout
Red zones - Red zones are formed daily
10 days average ranges
Blue zones - Blue zones are formed every week
10 weeks average ranges
Green zones - Green zones are formed every month
10 months averange ranges
Red zones - Red zones are formed daily
10 days average ranges
Blue zones - Blue zones are formed every week
10 weeks average ranges
Green zones - Green zones are formed every month
10 months averange ranges
發行說明
It will just plot the close price發行說明
It will plot the previous day's high and low發行說明
Now it will plot previous day , previous week and previous month high and low開源腳本
秉持TradingView一貫精神,這個腳本的創作者將其設為開源,以便交易者檢視並驗證其功能。向作者致敬!您可以免費使用此腳本,但請注意,重新發佈代碼需遵守我們的社群規範。
免責聲明
這些資訊和出版物並非旨在提供,也不構成TradingView提供或認可的任何形式的財務、投資、交易或其他類型的建議或推薦。請閱讀使用條款以了解更多資訊。
開源腳本
秉持TradingView一貫精神,這個腳本的創作者將其設為開源,以便交易者檢視並驗證其功能。向作者致敬!您可以免費使用此腳本,但請注意,重新發佈代碼需遵守我們的社群規範。
免責聲明
這些資訊和出版物並非旨在提供,也不構成TradingView提供或認可的任何形式的財務、投資、交易或其他類型的建議或推薦。請閱讀使用條款以了解更多資訊。