OPEN-SOURCE SCRIPT
已更新 Advanced RSI Helper

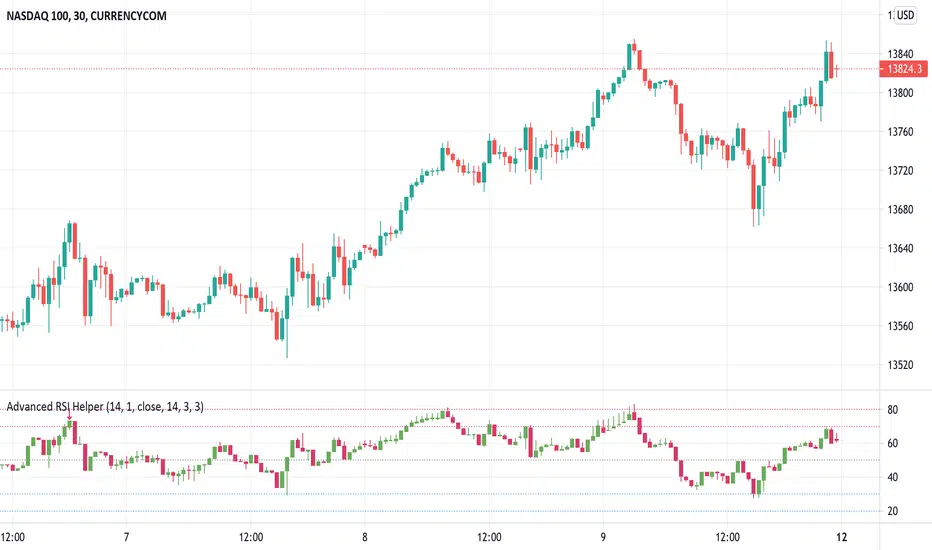
Here is Advanced RSI Helper. An advanced RSI represented in a candle type chart. It contains a Stochastic and a Pivot Detector (High-Low) and RSI divergences.
It also contains a Filter which you can configure the upper, lower zone to colorize the bars on the chart only when you are overbought or oversold, when you are in range the bars appear "transparent".
You also have the option of placing alerts for divergences or when the rsi exceeds the upper zone 1 / 2 or lower zone 1 / 2.
if you encounter any bugs do not hesitate to let me know in the comment area. The same goes for your suggestions.
Cheers and remember, risk management is the most important!
發行說明
-Bug fix.發行說明
-Minor improvement.發行說明
-Minor improvements.發行說明
-Displaced the "RSI Filter Bar Color" into my other indicator "Rain On Me PRO 1/3" cause it was making conflict with it when used together.發行說明
-Less "flashy" Bar Color.發行說明
-Minor improvements.發行說明
-New option added "Show RSI Meter" in setting. That will help newbie to understand RSI fundamentals and can show you easily the RSI state in one look :)Thank to all for your supports!
發行說明
-Code cleaning and minor improvements.發行說明
-Minor improvement.發行說明
-Removed "RSI Meter" cause it need display improvement.開源腳本
秉持TradingView一貫精神,這個腳本的創作者將其設為開源,以便交易者檢視並驗證其功能。向作者致敬!您可以免費使用此腳本,但請注意,重新發佈代碼需遵守我們的社群規範。
Telegram: t.me/+erb2pUEsHc43NmRk
E-mail: support@ricksimpsontrading.com
E-mail: support@ricksimpsontrading.com
免責聲明
這些資訊和出版物並非旨在提供,也不構成TradingView提供或認可的任何形式的財務、投資、交易或其他類型的建議或推薦。請閱讀使用條款以了解更多資訊。
開源腳本
秉持TradingView一貫精神,這個腳本的創作者將其設為開源,以便交易者檢視並驗證其功能。向作者致敬!您可以免費使用此腳本,但請注意,重新發佈代碼需遵守我們的社群規範。
Telegram: t.me/+erb2pUEsHc43NmRk
E-mail: support@ricksimpsontrading.com
E-mail: support@ricksimpsontrading.com
免責聲明
這些資訊和出版物並非旨在提供,也不構成TradingView提供或認可的任何形式的財務、投資、交易或其他類型的建議或推薦。請閱讀使用條款以了解更多資訊。