OPEN-SOURCE SCRIPT
已更新 Stablecoin supplies [USD bn]
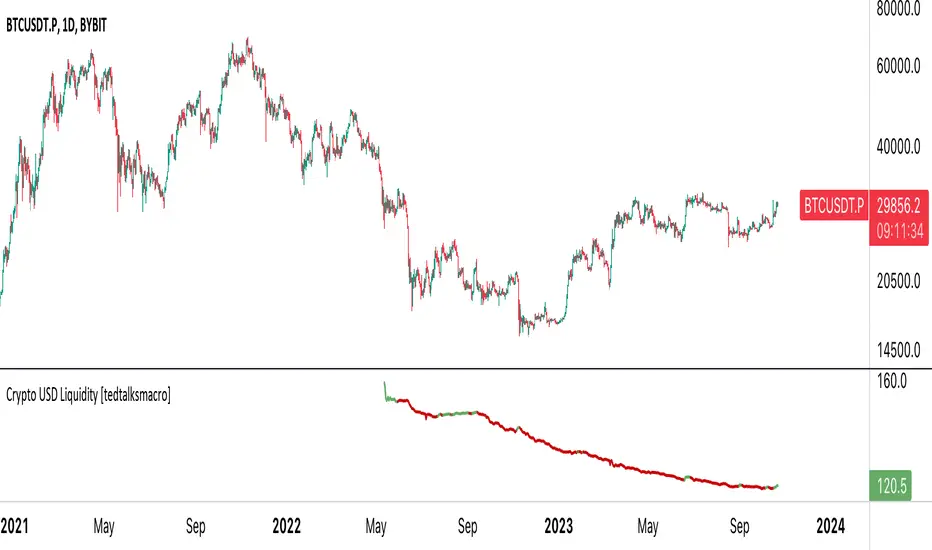
This script shows crypto market inflows/outflows by showing the USD stablecoin supplies, using data from https://glassnode.com/:
 BUSD_SUPPLY
 USDT_SUPPLY
 USDC_SUPPLY
Using a simple 20 EMA, the line will change color showing stablecoin inflow or outflow. Traders can consider stable coin inflows (green) as bullish for Bitcoin price, while stable coin outflows (red) should be considered bearish for price.
Using a simple 20 EMA, the line will change color showing stablecoin inflow or outflow. Traders can consider stable coin inflows (green) as bullish for Bitcoin price, while stable coin outflows (red) should be considered bearish for price.
發行說明
Script title update發行說明
Designed to visualize the total liquidity of major stablecoins in the cryptocurrency market. The liquidity is calculated by summing the supply values of five leading stablecoins: USDT, BUSD, USDC, DAI, and TUSD. Based on the comparison of the current liquidity value with its EMA, the script colors the plotted line either green (when above the EMA) or red (when below the EMA), helping traders visually identify bullish or bearish liquidity trends.
開源腳本
秉持TradingView一貫精神,這個腳本的創作者將其設為開源,以便交易者檢視並驗證其功能。向作者致敬!您可以免費使用此腳本,但請注意,重新發佈代碼需遵守我們的社群規範。
免責聲明
這些資訊和出版物並非旨在提供,也不構成TradingView提供或認可的任何形式的財務、投資、交易或其他類型的建議或推薦。請閱讀使用條款以了解更多資訊。
開源腳本
秉持TradingView一貫精神,這個腳本的創作者將其設為開源,以便交易者檢視並驗證其功能。向作者致敬!您可以免費使用此腳本,但請注意,重新發佈代碼需遵守我們的社群規範。
免責聲明
這些資訊和出版物並非旨在提供,也不構成TradingView提供或認可的任何形式的財務、投資、交易或其他類型的建議或推薦。請閱讀使用條款以了解更多資訊。