PROTECTED SOURCE SCRIPT
デイトレサポライン
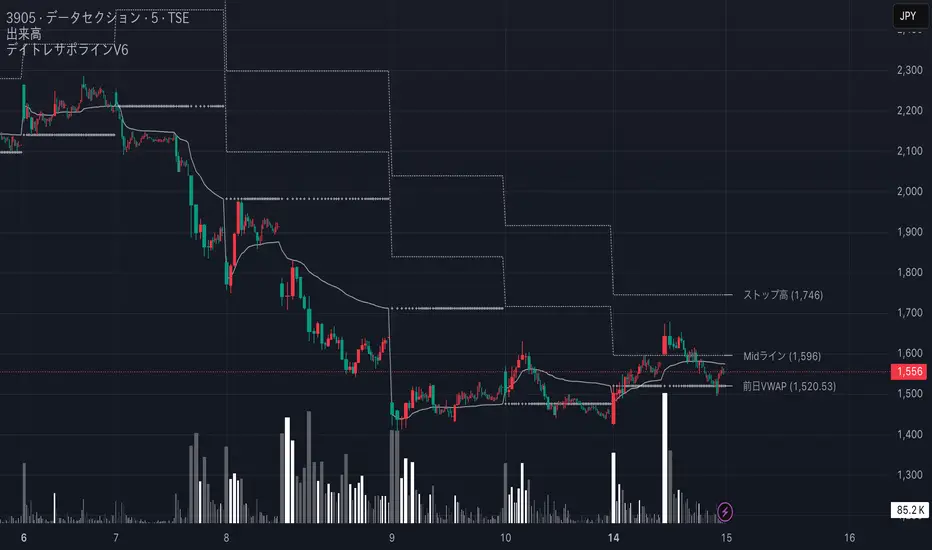
🇯🇵 デイトレサポライン — ストップ高・Mid・前日VWAP・当日VWAPをまとめて可視化!
デイトレードにおいて重要な 節目ライン(ストップ高/Midライン/前日VWAP/当日VWAP) を、チャート上に自動で延長表示するインジケーターです。
朝の寄り付きから引けまで、意識されやすい価格帯を一目で把握することができます。
📝 主な機能
✅ ストップ高ライン … 前日の終値+値幅制限から自動計算&延長表示
✅ Midライン … ストップ高と前日終値の中間価格
✅ 前日VWAP … 1分足ベースで算出した前アンカーVWAPを延長表示
✅ 当日VWAP … TradingView公式のVWAPロジック(Script2準拠)を1分足で再現
それぞれのラインは、表示・非表示や色の変更が可能。延長バー数も自由に設定できます。
📈 使いどころ
寄り付き後の 反発・反落の目安ライン として活用
VWAP・Mid・ストップ高など、機関投資家や短期勢が意識する節目価格を可視化
板読みやスキャルピング、短期の押し目・戻り売り戦略との併用にも最適
⚠️ 注意点
本インジケーターは 標準の値幅制限(1倍) に基づいています。
→ 4倍値幅(IPO2日目・急騰時など)には対応していません。
出来高データが提供されていないシンボルではVWAPが動作しません。
値幅制限ルールが変更された場合は、コードの更新が必要になる場合があります。
📌 デイトレで重要なラインを1本ずつ手描きする手間を省き、視覚的にすばやく戦略を立てられるサポートツールです。
🇯🇵Day Trade Support Lines — Visualize Limit-Up, Mid, Previous VWAP & Current VWAP at a Glance
This indicator automatically plots and extends key intraday levels — Limit-Up, Mid Line, Previous VWAP, and Current VWAP — directly on your chart.
It helps you instantly identify critical price zones that are often watched closely from the market open to the close.
📝 Key Features
✅ Limit-Up Line – Automatically calculated from the previous close + official price limit, then extended forward
✅ Mid Line – Midpoint between the previous close and the limit-up price
✅ Previous VWAP – Extended 1-minute based previous anchor VWAP
✅ Current VWAP – Reproduces TradingView’s official VWAP logic (Script2) on 1-minute data
All lines can be toggled on/off, customized in color, and extended for any number of bars.
📈 Best Use Cases
Use these levels as potential reaction zones after the market opens
Visualize institutionally watched price levels like VWAP, Mid, and Limit-Up
Ideal for scalping, tape reading, and short-term breakout or pullback strategies
⚠️ Notes
This indicator is based on standard (1x) price limits.
→ 4x price limits (e.g., on IPO day 2 or extreme rally days) are not supported.
VWAP will not function on symbols where volume data is not provided.
If official TSE price limit rules change, the indicator may need updates.
📌 This tool eliminates the need to manually draw key intraday levels one by one, allowing you to quickly plan your trading strategy visually.
受保護腳本
此腳本以閉源形式發佈。 不過,您可以自由且不受任何限制地使用它 — 在此處了解更多資訊。
免責聲明
這些資訊和出版物並不意味著也不構成TradingView提供或認可的金融、投資、交易或其他類型的意見或建議。請在使用條款閱讀更多資訊。
免責聲明
這些資訊和出版物並不意味著也不構成TradingView提供或認可的金融、投資、交易或其他類型的意見或建議。請在使用條款閱讀更多資訊。