PROTECTED SOURCE SCRIPT
45pointsJ3FF Enhanced
# 45pointsJ3FF Enhanced Pine Script Indicator
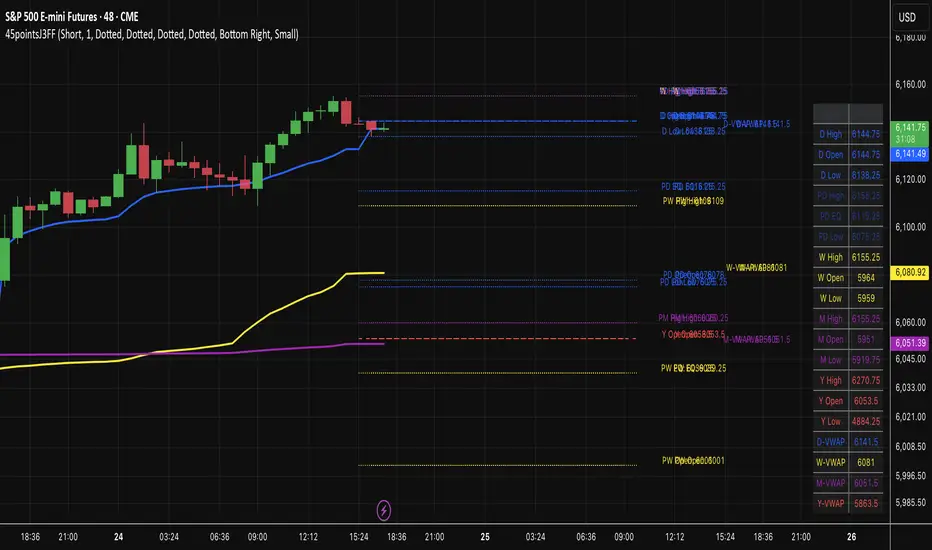
This is a comprehensive multi-timeframe support and resistance indicator for TradingView that displays key price levels and VWAP (Volume Weighted Average Price) across different time periods.
## 🎯 **Core Functionality**
The indicator plots critical price levels from multiple timeframes simultaneously on your chart, helping traders identify key support/resistance zones and volume-based price levels.
## 📊 **Key Levels Displayed**
### **Multi-Timeframe Levels:**
- **Daily**: Open, High, Low + Previous Day levels
- **Weekly**: Open, High, Low + Previous Week levels
- **Monthly**: Open, High, Low + Previous Month levels
- **Yearly**: Open, High, Low + Previous Year levels
### **Equilibrium Levels:**
- **50% Retracement** levels for previous periods (midpoint between high and low)
- Helps identify potential reversal zones
### **VWAP Levels:**
- **Daily VWAP**: Volume-weighted average for current day
- **Weekly VWAP**: Custom calculation for current week
- **Monthly VWAP**: Custom calculation for current month
- **Yearly VWAP**: Custom calculation for current year
## ⚙️ **Customization Options**
### **Display Controls:**
- **Individual toggles** for each timeframe (Daily/Weekly/Monthly/Yearly)
- **Previous period toggles** to show/hide historical levels
- **Line extension options**: Short, Right, Both
- **Adjustable line width** (1-3 pixels)
### **Visual Customization:**
- **Custom colors** for each timeframe
- **Individual line styles** (Solid, Dashed, Dotted) for each timeframe
- **Price labels** can be toggled on/off for lines and VWAPs
### **Price Table Features:**
- **Comprehensive side table** showing all active level prices
- **4 position options**: Top/Bottom + Left/Right corners
- **3 size options**: Small, Normal, Large
- **Color-coded entries** matching chart lines
- **Auto-filtering**: Only shows enabled levels
## 🔧 **Technical Implementation**
### **VWAP Calculations:**
- **Daily**: Uses built-in `ta.vwap()` function
- **Weekly/Monthly/Yearly**: Custom accumulative calculations using volume-weighted price averaging
- **Timeframe Detection**: Higher timeframe VWAPs only show on intraday charts
### **Higher Timeframe Data:**
- Uses `request.security()` to fetch OHLC data from higher timeframes
- **Lookahead enabled** for real-time updates
- **Previous period data** accessed using `[1]` historical referencing
### **Drawing System:**
- **Dynamic line drawing** with customizable extension
- **Smart labeling system** with price formatting
- **Tick-rounded prices** for clean display
- **Performance optimized** with conditional drawing
## 📈 **Trading Applications**
### **Support & Resistance:**
- **Previous day/week/month highs and lows** act as key S/R levels
- **Opening levels** often serve as pivot points
- **Equilibrium levels** (50% retracements) are common reversal zones
### **VWAP Trading:**
- **Daily VWAP**: Intraday trend direction and mean reversion
- **Higher timeframe VWAPs**: Longer-term trend bias
- **Multiple VWAP confluence** creates stronger levels
### **Multi-Timeframe Analysis:**
- **Level confluence**: Multiple timeframes aligning creates stronger zones
- **Trend context**: Higher timeframe levels provide broader market context
- **Entry/Exit planning**: Previous period levels help plan trades
## 🎨 **Visual Organization**
### **Color Coding:**
- **Blue**: Daily levels (default)
- **Yellow**: Weekly levels (default)
- **Purple**: Monthly levels (default)
- **Red**: Yearly levels (default)
- **Transparency**: Previous period levels shown in lighter shades
### **Line Styles:**
- **Solid lines**: Current period highs/lows
- **Dashed lines**: Opening levels
- **Dotted lines**: Previous period levels
- **Thick lines**: VWAP plots (2px width)
## 🔍 **Unique Features**
1. **Custom VWAP calculations** for weekly/monthly/yearly periods
2. **Intelligent table display** that only shows active levels
3. **Comprehensive customization** without overwhelming interface
4. **Performance optimized** with conditional rendering
5. **Professional presentation** with watermark and clean styling
This indicator is particularly valuable for traders who use multiple timeframe analysis and want a clean, organized way to visualize key price levels and volume-based averages all in one tool.
受保護腳本
此腳本以閉源形式發佈。 不過,您可以自由使用,沒有任何限制 — 點擊此處了解更多。
免責聲明
這些資訊和出版物並非旨在提供,也不構成TradingView提供或認可的任何形式的財務、投資、交易或其他類型的建議或推薦。請閱讀使用條款以了解更多資訊。
免責聲明
這些資訊和出版物並非旨在提供,也不構成TradingView提供或認可的任何形式的財務、投資、交易或其他類型的建議或推薦。請閱讀使用條款以了解更多資訊。