OPEN-SOURCE SCRIPT
BTC Longs/Shorts ratio by [VanHelsing]

BTC Longs/Shorts ratio
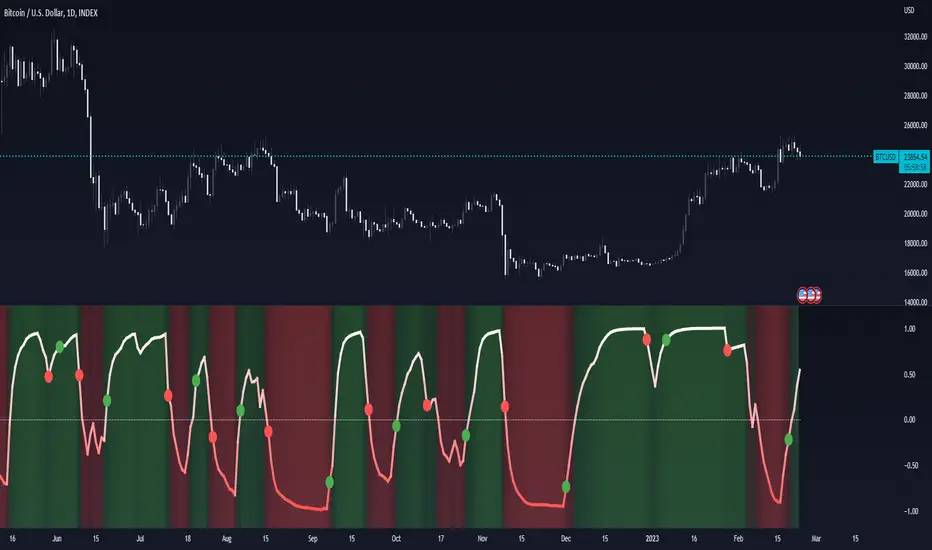
It is a sentiment indicator. It uses data from Bitfinex longs chart and shorts chart.
When ratio line going up it simply means most of the people from Bitfinex buying BTC when it goes down selling.
So in this way we know bull and bear presure
But it is only one exchange? Yes, but it is enough accurate for BTC, for ETH it is not so good.
How it works:
With request security function was called the closes of longs and shorts charts
and then with simple calculation was extracted a ratio of it and rescaled to make it easy to read.
When ratio line moves up it gradualy changing background from -1 to 1 from red to green and vice versa to understad what is a trend or a majore sentiment of people
After ratio was ploted, I created a smoothed ratio line with sma to extract signals from it buy and sell in a form of green and red circles.
How to read it:
開源腳本
In true TradingView spirit, the creator of this script has made it open-source, so that traders can review and verify its functionality. Kudos to the author! While you can use it for free, remember that republishing the code is subject to our House Rules.
免責聲明
The information and publications are not meant to be, and do not constitute, financial, investment, trading, or other types of advice or recommendations supplied or endorsed by TradingView. Read more in the Terms of Use.