OPEN-SOURCE SCRIPT
Dynamic Volume Based Key Price Levels
Description
This indicator introduces a volume-based approach to detecting support and resistance zones.
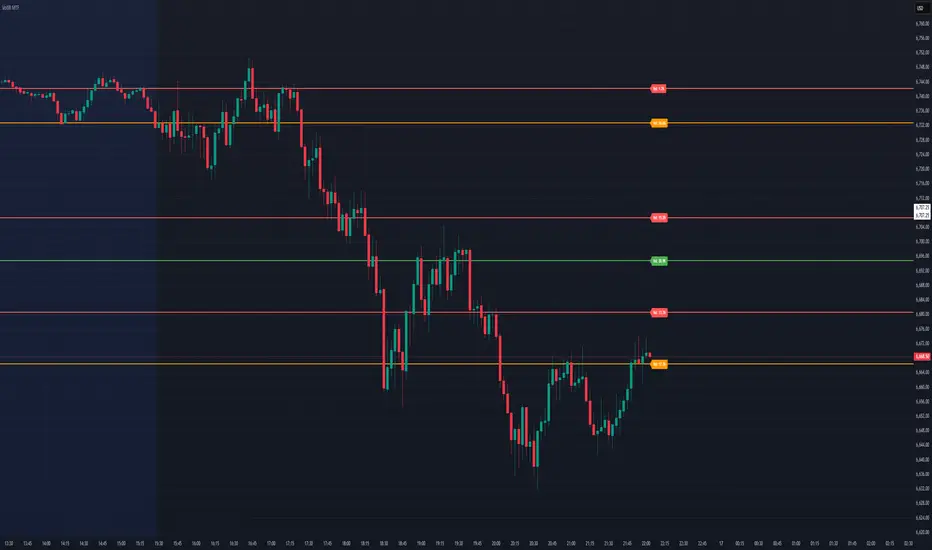
Instead of relying on price swings or pivots, it analyzes where the most trading activity occurred within a selected lookback period, then marks those levels directly on the chart.
The result is a clear visual map of price areas with strong historical participation, which often act as reaction zones in future moves.
How It Works
The script divides the analyzed range into price bins, sums traded volume for each bin, and highlights the strongest levels based on their share of total volume.
It also includes an optional multi-timeframe mode, allowing traders to analyze higher timeframe volume structures on a lower timeframe chart.
Key Features
🔹 Volume-Based Key Levels Detection: Finds statistically meaningful price zones derived from raw volume data.
🔹 Multi-Timeframe Mode: Optionally use higher timeframe volume to identify key market structure levels.
🔹 Visual Customization: Configure colors, line styles, transparency, and label formatting.
🔹 Automatic Ranking: Highlights the strongest to weakest levels using a color gradient.
🔹 Dynamic Updates: Levels adapt automatically as new bars form.
Inputs Overview
How to Use
This tool helps visualize where market participation was strongest, giving traders a clearer view of potential reaction zones for both intraday and swing analysis.
It’s intended as a visual analytical aid, not a signal generator.
⚠️Disclaimer:
This script is provided for educational and informational purposes only. It is not financial advice and should not be considered a recommendation to buy, sell, or hold any financial instrument. Trading involves significant risk of loss and is not suitable for every investor. Users should perform their own due diligence and consult with a licensed financial advisor before making any trading decisions. The author does not guarantee any profits or results from using this script, and assumes no liability for any losses incurred. Use this script at your own risk.
This indicator introduces a volume-based approach to detecting support and resistance zones.
Instead of relying on price swings or pivots, it analyzes where the most trading activity occurred within a selected lookback period, then marks those levels directly on the chart.
The result is a clear visual map of price areas with strong historical participation, which often act as reaction zones in future moves.
How It Works
The script divides the analyzed range into price bins, sums traded volume for each bin, and highlights the strongest levels based on their share of total volume.
It also includes an optional multi-timeframe mode, allowing traders to analyze higher timeframe volume structures on a lower timeframe chart.
Key Features
🔹 Volume-Based Key Levels Detection: Finds statistically meaningful price zones derived from raw volume data.
🔹 Multi-Timeframe Mode: Optionally use higher timeframe volume to identify key market structure levels.
🔹 Visual Customization: Configure colors, line styles, transparency, and label formatting.
🔹 Automatic Ranking: Highlights the strongest to weakest levels using a color gradient.
🔹 Dynamic Updates: Levels adapt automatically as new bars form.
Inputs Overview
- Lookback Bars: Number of historical bars used for analysis.
- Price Bins: Defines the precision of volume distribution.
- Number of Lines: How many key levels to display.
- Min Volume %: Filters out less relevant low-volume bins.
- Extend Lines: Choose how lines are projected into the future.
- Use Higher Timeframe: Pull data from a higher timeframe for broader perspective.
How to Use
- Apply the indicator to your chart and adjust the lookback period.
- Optionally enable higher timeframe mode for more stable long-term zones.
- Observe the horizontal lines — these represent volume-weighted support and resistance areas.
- Combine with your existing tools for trend or momentum confirmation.
This tool helps visualize where market participation was strongest, giving traders a clearer view of potential reaction zones for both intraday and swing analysis.
It’s intended as a visual analytical aid, not a signal generator.
⚠️Disclaimer:
This script is provided for educational and informational purposes only. It is not financial advice and should not be considered a recommendation to buy, sell, or hold any financial instrument. Trading involves significant risk of loss and is not suitable for every investor. Users should perform their own due diligence and consult with a licensed financial advisor before making any trading decisions. The author does not guarantee any profits or results from using this script, and assumes no liability for any losses incurred. Use this script at your own risk.
開源腳本
秉持TradingView一貫精神,這個腳本的創作者將其設為開源,以便交易者檢視並驗證其功能。向作者致敬!您可以免費使用此腳本,但請注意,重新發佈代碼需遵守我們的社群規範。
免責聲明
這些資訊和出版物並非旨在提供,也不構成TradingView提供或認可的任何形式的財務、投資、交易或其他類型的建議或推薦。請閱讀使用條款以了解更多資訊。
開源腳本
秉持TradingView一貫精神,這個腳本的創作者將其設為開源,以便交易者檢視並驗證其功能。向作者致敬!您可以免費使用此腳本,但請注意,重新發佈代碼需遵守我們的社群規範。
免責聲明
這些資訊和出版物並非旨在提供,也不構成TradingView提供或認可的任何形式的財務、投資、交易或其他類型的建議或推薦。請閱讀使用條款以了解更多資訊。