OPEN-SOURCE SCRIPT
Candle Strategy
This strategy is based candle count number also strategy analysis -
Rules for buy-
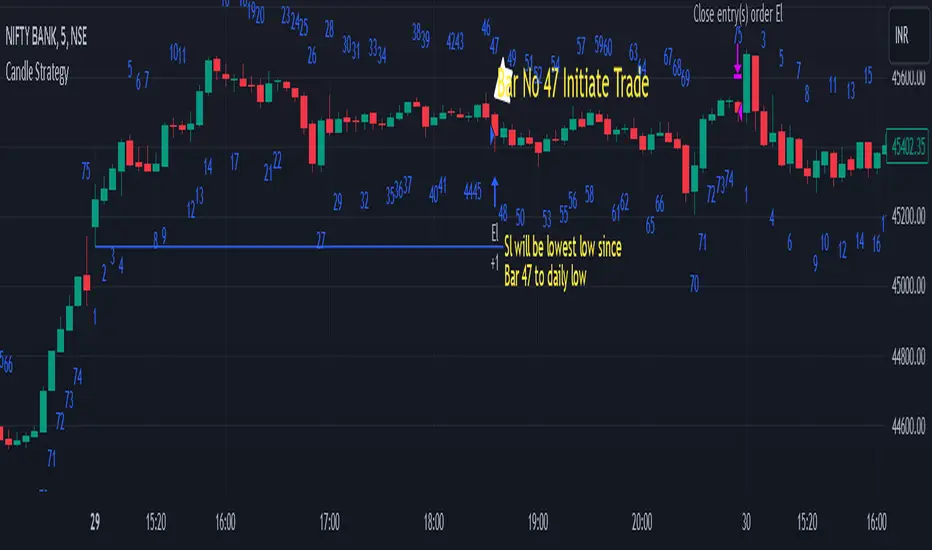
1) choose Candle Number(Ex.-47) For Trade
2) Trade Sell if price is above high of day 1st candle that mean direction is upside
3) We are taking stop loss on lowest low of candle since day first candle to trade no.
4) close Trade at last bar of the day
5) Trader Can Choose Trade Direction From input

Rules for Sell-
1) Choose Candle Number(Ex.-47) For Trade
2) Trade Sell if price is below low of day 1st candle that mean direction is downside
3) We are taking stop loss on highest of candle since day first candle to trade no.
4) close Trade at last bar of the day
5) Trader Can Choose Trade Direction From input
Note - this strategy can be also use for static to understand which candle will make low/high of the day high chance Example in bank nifty 5 minutes chart candle no 47 have highest trade
opportunity appear on long side ...this data is small based on 5000 previous bar ...
Disclaimer: market involves significant risks, including complete possible loss of funds. Consequently trading is not suitable for all investors and traders. By increasing leverage risk increases as well.With the demo account you can test any trading strategies you wish in a risk-free environment. Please bear in mind that the results of the transactions of the practice account are virtual, and do not reflect any real profit or loss or a real trading environment, whereas market conditions may affect both the quotation and execution
Rules for buy-
1) choose Candle Number(Ex.-47) For Trade
2) Trade Sell if price is above high of day 1st candle that mean direction is upside
3) We are taking stop loss on lowest low of candle since day first candle to trade no.
4) close Trade at last bar of the day
5) Trader Can Choose Trade Direction From input
Rules for Sell-
1) Choose Candle Number(Ex.-47) For Trade
2) Trade Sell if price is below low of day 1st candle that mean direction is downside
3) We are taking stop loss on highest of candle since day first candle to trade no.
4) close Trade at last bar of the day
5) Trader Can Choose Trade Direction From input
Note - this strategy can be also use for static to understand which candle will make low/high of the day high chance Example in bank nifty 5 minutes chart candle no 47 have highest trade
opportunity appear on long side ...this data is small based on 5000 previous bar ...
Disclaimer: market involves significant risks, including complete possible loss of funds. Consequently trading is not suitable for all investors and traders. By increasing leverage risk increases as well.With the demo account you can test any trading strategies you wish in a risk-free environment. Please bear in mind that the results of the transactions of the practice account are virtual, and do not reflect any real profit or loss or a real trading environment, whereas market conditions may affect both the quotation and execution
開源腳本
秉持TradingView一貫精神,這個腳本的創作者將其設為開源,以便交易者檢視並驗證其功能。向作者致敬!您可以免費使用此腳本,但請注意,重新發佈代碼需遵守我們的社群規範。
免責聲明
這些資訊和出版物並非旨在提供,也不構成TradingView提供或認可的任何形式的財務、投資、交易或其他類型的建議或推薦。請閱讀使用條款以了解更多資訊。
開源腳本
秉持TradingView一貫精神,這個腳本的創作者將其設為開源,以便交易者檢視並驗證其功能。向作者致敬!您可以免費使用此腳本,但請注意,重新發佈代碼需遵守我們的社群規範。
免責聲明
這些資訊和出版物並非旨在提供,也不構成TradingView提供或認可的任何形式的財務、投資、交易或其他類型的建議或推薦。請閱讀使用條款以了解更多資訊。