OPEN-SOURCE SCRIPT
Moving CO-covariance (covariance on covariance)
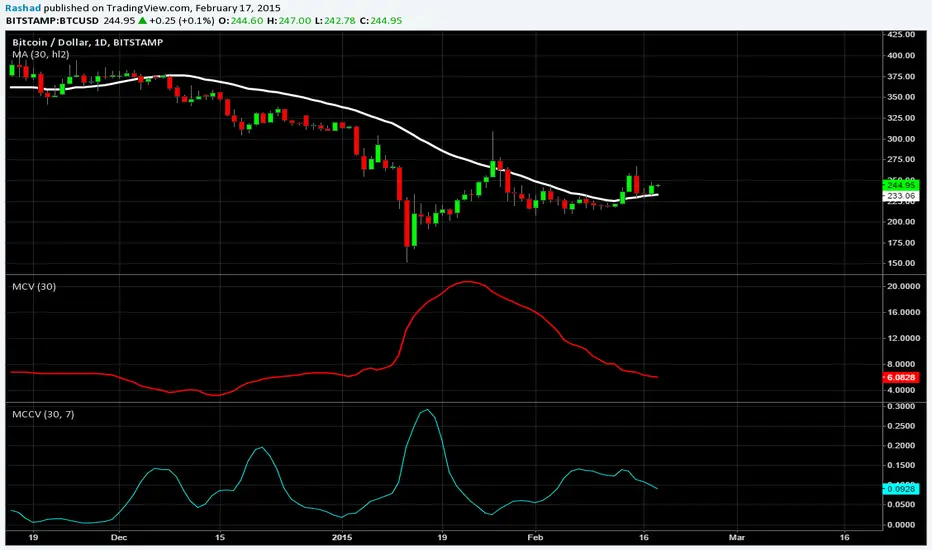
This is Covariance on Covariance. It shows you how much a given covariance period has deviated from it mean over another defined period. Because it is a time series, It can allow you to spot changes in how covariance changes. You can apply trend lines, Fibonacci retracements, etc. This is also volume weighting covariance.
This is not a directional indicator nor is moving covariance. This is used for forecasting volatility. This must be used in conjunction with moving covariance.
This is not a directional indicator nor is moving covariance. This is used for forecasting volatility. This must be used in conjunction with moving covariance.
開源腳本
本著TradingView的真正精神,此腳本的創建者將其開源,以便交易者可以查看和驗證其功能。向作者致敬!雖然您可以免費使用它,但請記住,重新發佈程式碼必須遵守我們的網站規則。
免責聲明
這些資訊和出版物並不意味著也不構成TradingView提供或認可的金融、投資、交易或其他類型的意見或建議。請在使用條款閱讀更多資訊。
免責聲明
這些資訊和出版物並不意味著也不構成TradingView提供或認可的金融、投資、交易或其他類型的意見或建議。請在使用條款閱讀更多資訊。