OPEN-SOURCE SCRIPT
Tweezer Patterns
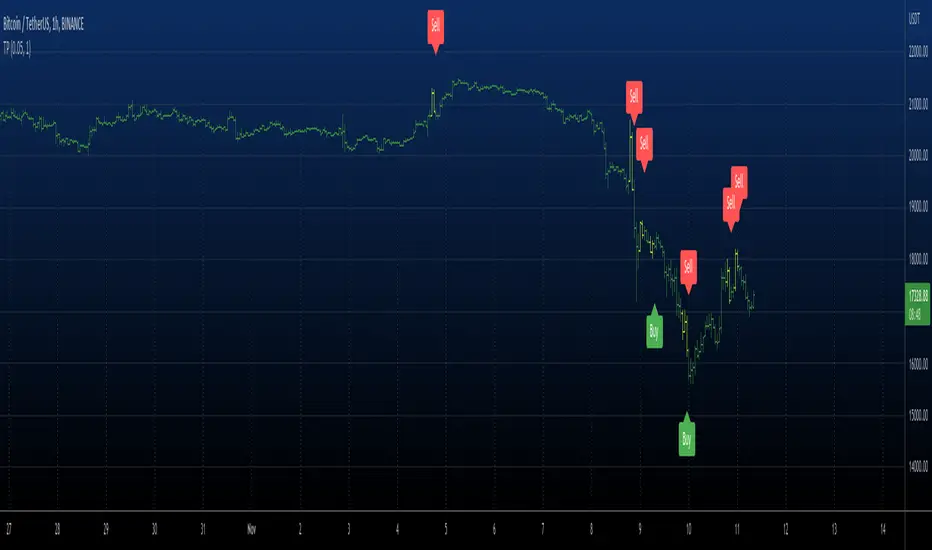
Tweezer top and bottom, also known as tweezers, are reversal candlestick patterns
that signal a potential change in the price direction. Both formations consist of
two candles that occur at the end of a trend, which is in its dying stages.
The tweezer bottom candlestick pattern is a bullish reversal pattern that can be
spotted at the bottom of a downtrend. It consists of two candles, where the first
candle is in line with the bearish trend, while the second candle reflects more
bullish market sentiment as the price bursts higher, in the opposite trend.
The tweezer top candlestick pattern is of the same structure as the tweezer bottom,
except for the fact that it happens at the end of an uptrend, and therefore, it is a
bearish reversal pattern. The first candle is bullish, and it continues in the same
direction, while the second bearish candle indicates that the trend may be changing soon.
Both the bottom and top tweezers are only valid when they occur during uptrends and downtrends.
Their appearance during choppy trading conditions is practically meaningless, and it signals
the market indecision to move in either direction.
WARNING:
- For purpose educate only
- This script to change bars colors.
開源腳本
本著TradingView的真正精神,此腳本的創建者將其開源,以便交易者可以查看和驗證其功能。向作者致敬!雖然您可以免費使用它,但請記住,重新發佈程式碼必須遵守我們的網站規則。
免責聲明
這些資訊和出版物並不意味著也不構成TradingView提供或認可的金融、投資、交易或其他類型的意見或建議。請在使用條款閱讀更多資訊。
開源腳本
本著TradingView的真正精神,此腳本的創建者將其開源,以便交易者可以查看和驗證其功能。向作者致敬!雖然您可以免費使用它,但請記住,重新發佈程式碼必須遵守我們的網站規則。
免責聲明
這些資訊和出版物並不意味著也不構成TradingView提供或認可的金融、投資、交易或其他類型的意見或建議。請在使用條款閱讀更多資訊。