INVITE-ONLY SCRIPT
已更新 pi RSI Strategy
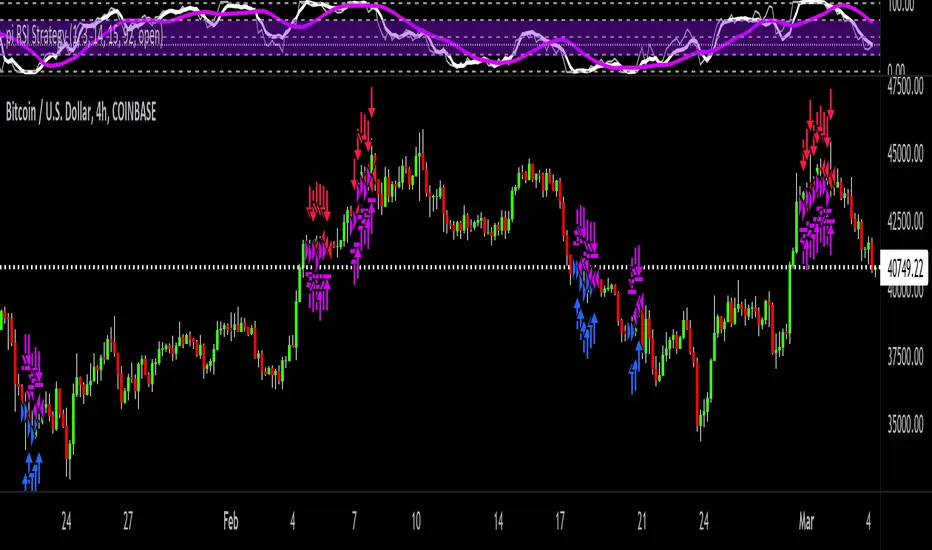
piRSI Strategy is based on my relative strength index indicator pi RSI because it uses the first 15 sequential numbers in Archimedes constant "pi" 3.14159265358979.. I felt that the never ending, non-repeated number, pi, was a good candidate for an input that tracks the constantly changing trends these days.
This is a price momentum strategy that helps you evaluate overbought or oversold conditions. By the default colors, when the white line is above the purple it's going bullish. And when the white line is under the purple it's going bearish.
Also, on the scale, 50 is neutral, below 25 is getting oversold and above 75 is getting overbought. This strategy is useful in conjunction with other price and volume indicators / strategies to help redundantly confirm future price action.
I've spent exhaustive effort on new research & development, engineering, back testing accuracy, real time capital testing, & future version revision of my trading indicator / strategy scripts.
發行說明
@version5 update發行說明
header update僅限邀請腳本
僅作者批准的使用者才能訪問此腳本。您需要申請並獲得使用許可,通常需在付款後才能取得。更多詳情,請依照作者以下的指示操作,或直接聯絡Options360。
TradingView不建議在未完全信任作者並了解其運作方式的情況下購買或使用腳本。您也可以在我們的社群腳本中找到免費的開源替代方案。
作者的說明
Request use and I'll accept it.
Trading indicators:
tradingview.com/u/Options360/
tradingview.com/u/Options360/
免責聲明
這些資訊和出版物並非旨在提供,也不構成TradingView提供或認可的任何形式的財務、投資、交易或其他類型的建議或推薦。請閱讀使用條款以了解更多資訊。
僅限邀請腳本
僅作者批准的使用者才能訪問此腳本。您需要申請並獲得使用許可,通常需在付款後才能取得。更多詳情,請依照作者以下的指示操作,或直接聯絡Options360。
TradingView不建議在未完全信任作者並了解其運作方式的情況下購買或使用腳本。您也可以在我們的社群腳本中找到免費的開源替代方案。
作者的說明
Request use and I'll accept it.
Trading indicators:
tradingview.com/u/Options360/
tradingview.com/u/Options360/
免責聲明
這些資訊和出版物並非旨在提供,也不構成TradingView提供或認可的任何形式的財務、投資、交易或其他類型的建議或推薦。請閱讀使用條款以了解更多資訊。