OPEN-SOURCE SCRIPT
Candle Volume (Alender)
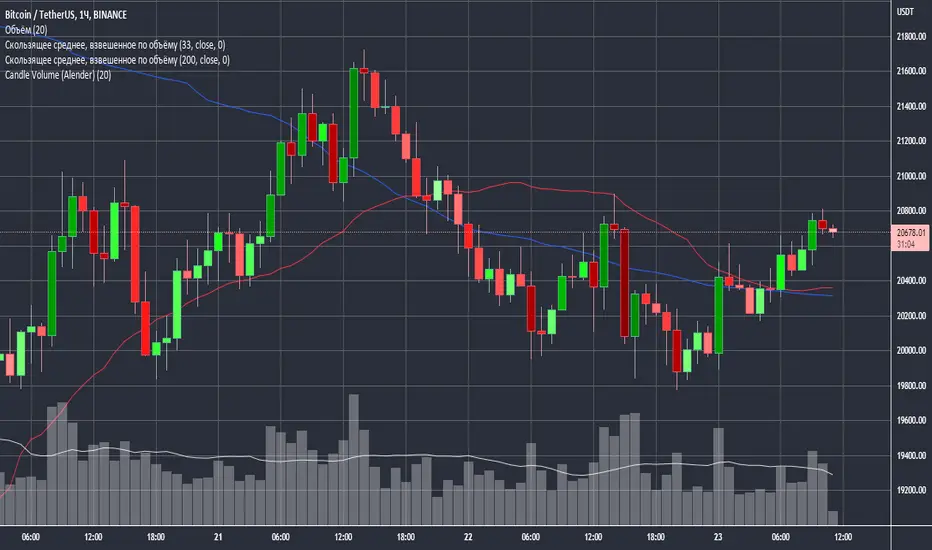
Candle Volume by Alender is an indicator that changes the color of candles depending on the volume.
If you use VSA (Volume Spread Analysis) - this indicator will allow you to quickly assess the market situation.
For plotting, a moving average by volume for the specified period is used. Volume/Average * 100 - percentage of the current volume from the average.
* If the current volume is less than the average - the candle will be proportionally (0-100%) lighter than red (for bearish candles) or green (for bullish candles). For 0% - the candle is as light as possible.
* If the current volume is greater than the average, the candle will be proportionately (100-400%) darker than red (for bearish candles) or green (for bullish candles). For 400% and more - the candle is as dark as possible.
開源腳本
本著TradingView的真正精神,此腳本的創建者將其開源,以便交易者可以查看和驗證其功能。向作者致敬!雖然您可以免費使用它,但請記住,重新發佈程式碼必須遵守我們的網站規則。
免責聲明
這些資訊和出版物並不意味著也不構成TradingView提供或認可的金融、投資、交易或其他類型的意見或建議。請在使用條款閱讀更多資訊。
開源腳本
本著TradingView的真正精神,此腳本的創建者將其開源,以便交易者可以查看和驗證其功能。向作者致敬!雖然您可以免費使用它,但請記住,重新發佈程式碼必須遵守我們的網站規則。
免責聲明
這些資訊和出版物並不意味著也不構成TradingView提供或認可的金融、投資、交易或其他類型的意見或建議。請在使用條款閱讀更多資訊。