Crypto Spot Volume Ratio**Overview**
This TradingView Pine Script v7 indicator computes and visualizes each exchange’s spot‐volume share relative to the average across ten major venues. By plotting ten “volume coefficients” around a baseline of 1, you immediately see which exchanges are trading above or below the aggregate average in each bar (timeframe period).
---
## 1. Data Sources
The script pulls spot trading volume for the current symbol (e.g. BTC/USDT, ETH/USDT, SOL/USDT, etc.) from these ten exchanges:
* Binance
* OKX
* Bybit
* KuCoin
* Gate.io
* HTX
* Kraken (USD pair)
* Coinbase (USD pair)
* Bitstamp (USD pair)
* Bitfinex (USD pair)
For USD-quoted venues (Coinbase, Kraken, Bitstamp, Bitfinex), it automatically converts the symbol suffix from “USDT” to “USD.”
---
## 2. Calculation Steps
1. **Fetch Volumes**
Using `request.security`, the script retrieves `volume` from each exchange’s contract at the chart’s timeframe.
2. **Sum and Average**
* **Total Volume (`sumVol`)** = sum of all ten exchanges’ volumes.
* **Average Volume (`avgVol`)** = `sumVol / 10‘.
3. **Compute Coefficients**
For each exchange *i*,
A coefficient > 1 means that exchange’s volume is above the ten‐exchange average; < 1 means below average.
4. **Rendering**
* **Table**: A horizontal row in the top‐right corner lists each enabled exchange’s coefficient (formatted to two decimals).
* **Plots**: Ten overlaid line plots show each exchange’s coefficient time series. A dashed horizontal line at **1** marks the average baseline.
---
## 3. Configuration Options
In the indicator’s settings panel, you can toggle **“Show …”** for any of the ten exchanges. Disabling an exchange will hide both its table entry and its plotted line—but does **not** change the average calculation (which always divides by 10).
---
## 4. Interpretation & Significance
* **Relative Activity**: By normalizing each venue to the ten‐exchange average, you spot shifts in where volume is concentrated.
* **Liquidity Insights**: Exchanges consistently above 1 may offer deeper liquidity, tighter spreads, or attract more order flow. Those below 1 may lag on volume, signaling lower activity or potential outages.
* **Arbitrage & Flow Monitoring**: Sudden spikes on a particular exchange (coefficient >> 1) can indicate localized buying/selling pressure, useful for spotting arbitrage windows, large order flows, or exchange-specific events.
* **Market Health**: Tracking the dispersion of these coefficients over time gives you a quick visual of how balanced or skewed the overall market activity is across venues.
---
## 5. How It Works in Practice
1. **Attach** this indicator to any USDT or USD spot chart (e.g., BTCUSDT, ETHUSDT).
2. **Observe** which exchange lines rise above the dashed **1** line—those venues are currently trading more volume than the average of the ten.
3. **Use** the table to see exact coefficient values each bar.
4. **Toggle** exchanges on/off to focus on specific venues without affecting the universal average baseline.
By comparing ten exchanges on a single pane, you gain real-time clarity on where crypto liquidity and activity are most intense—and where it temporarily wanes—empowering more informed trading, arbitrage strategies, and market‐structure analysis.
Relativevolume

거래량 지표 전략 (최종)"Leverage 100x, 10% of capital committed, 0.3% profit target, 0.2% stop loss."
레버리지 100배 이용, 10프로 자본금 투입, 0.3프로 수익 , 0.2프로 손해
"Volume Indicator Strategy (Final)" Summary
This Pine Script strategy is designed to integrate volume data from multiple cryptocurrency exchanges (Binance, Bitget, OKX, Bybit) across spot and futures markets. It then uses this consolidated volume data to identify volume spikes and apply an RSI filter to generate buy/sell signals.
Key Features and Logic:
Multi-Exchange/Asset Volume Consolidation:
Based on user settings, it fetches and sums up spot and perpetual futures volume data from Binance, Bitget, OKX, and Bybit.
It uses the request.security function to query volume data from each specified exchange.
NA (Not Available) data points are safely handled and treated as 0 to prevent calculation errors.
Volume Spike Detection:
It calculates the Simple Moving Average (avg_volume) of the combined_volume over a lookback period (default 70 bars).
A vol_7x condition is met when the combined_volume is equal to or greater than 7 times (vol_multiplier_7x, user-configurable) the avg_volume.
RSI Filter (Optional):
An RSI (Relative Strength Index) filter (enable_rsi_filter, user-configurable) can be applied in conjunction with the volume spike condition.
Short Entry Condition: vol_7x (volume spike) & price_up (current bar's close is higher than the previous close) & RSI is 73 or greater (if filter is enabled).
Long Entry Condition: vol_7x (volume spike) & price_down (current bar's close is lower than the previous close) & RSI is 28 or less (if filter is enabled).
Strategy Entry/Exit:
When entry conditions are met, the strategy enters a position at market price.
It includes a re-entry cooldown period (default 10 bars) to prevent immediate re-entry in the same direction.
Fixed Take Profit and Stop Loss percentages (0.3% Take Profit, 0.2% Stop Loss) are set to manage open positions.
Visualization:
The combined_volume is plotted as columns (plot.style_columns) in a lower pane, changing color when the 7x volume spike condition is met.
The avg_volume is plotted as a line.
Volume values on the plot (and intended for the Y-axis scale) are formatted using format=format.volume to display in K (thousands), M (millions), B (billions) units.
The chart background color changes to indicate RSI overbought (>= 70, red) and oversold (<= 30, blue) zones.
Labels are displayed on the chart for individual trade P/L (Profit/Loss), and an info panel shows the total P/L over a user-defined period.
This strategy aims to capture significant market movements by aggregating volume data across various sources and combining it with price action and momentum (RSI) analysis to generate automated trading signals.
-------------------------------------------------------------------------------------------------------------
"거래량 지표 전략 (최종)" 요약
이 전략은 여러 암호화폐 거래소(바이낸스, 비트겟, OKX, 바이비트)의 현물(Spot) 및 선물(Futures) 거래량 데이터를 통합하여 사용하는 것을 핵심으로 합니다. 통합된 거래량 데이터를 바탕으로 거래량 급등을 포착하고 RSI 필터를 적용하여 매수/매도 신호를 생성하는 전략입니다.
주요 기능 및 로직:
다중 거래소/자산 거래량 통합:
사용자 설정에 따라 바이낸스, 비트겟, OKX, 바이비트의 현물 및 선물(무기한) 거래량을 개별적으로 가져와 합산합니다.
request.security 함수를 사용하여 각 거래소의 거래량 데이터를 요청합니다.
데이터가 없는 경우(NA)는 0으로 처리하여 계산 오류를 방지합니다.
거래량 급등 감지:
통합된 거래량(combined_volume)의 lookback 기간(기본 70봉) 이동평균(avg_volume)을 계산합니다.
combined_volume이 avg_volume의 7배(vol_multiplier_7x, 사용자 설정 가능) 이상으로 급등하면 vol_7x 조건을 만족합니다.
RSI 필터 (옵션):
거래량 급등 조건과 함께 RSI(상대 강도 지수) 필터(enable_rsi_filter, 사용자 설정 가능)를 적용할 수 있습니다.
매도(Short) 진입 조건: vol_7x (거래량 급등) & price_up (현재 봉 종가가 이전 봉보다 상승) & RSI가 73 이상일 때.
매수(Long) 진입 조건: vol_7x (거래량 급등) & price_down (현재 봉 종가가 이전 봉보다 하락) & RSI가 28 이하일 때.
전략 진입/청산:
위 진입 조건이 충족되면 시장가로 포지션에 진입합니다.
동일 방향으로 10봉 이내 재진입을 제한합니다.
고정 익절(Take Profit) 및 손절(Stop Loss) 비율(각각 0.3%, 0.2%)을 설정하여 포지션을 관리합니다.
시각화:
통합 거래량(combined_volume)은 차트 하단에 막대그래프(plot.style_columns)로 표시되며, 7배 급등 시 색상이 변경됩니다.
평균 거래량(avg_volume)은 선으로 표시됩니다.
거래량 값은 format=format.volume을 사용하여 K(천), M(백만), B(십억) 단위로 간소화되어 표시됩니다.
차트 배경색으로 RSI 과매수(70 이상, 빨간색) 및 과매도(30 이하, 파란색) 구간을 시각적으로 표시합니다.
개별 거래의 P/L(손익) 라벨과 지정된 기간 동안의 총 P/L을 차트 상단에 표시합니다.
이 전략은 여러 거래소의 거래량 데이터를 취합하여 시장의 전반적인 거래 활동을 파악하고, 이를 바탕으로 특정 패턴(거래량 급등 + 가격 방향 + RSI 필터)에 따라 매매 결정을 내리도록 설계되었습니다.

Relative Volume Candle Shaderthis indicator is based on the work of M0rty's "candle color by volume z-score"
I've taken M0rty's indicator a few steps further to yield a wider range of outputs, showing both extreme high and extreme lows of volume in 2 gradients.
the brightness of the candle is based on the z-score. brighter candles have unusually high volume, and dimmer candles have unusually low volume.

Volume Spike Analyzer(SMA10-Based)📊 **Volume Spike Analyzer (SMA10-Based)**
This indicator highlights abnormal volume activity by comparing current volume to the 10-period Simple Moving Average (SMA) of volume. It helps traders visually identify unusual activity that may precede breakouts, reversals, or news-driven moves.
---
🔧 **Features:**
• ✅ Colors volume bars:
• Green = Volume > SMA(10)
• Red = Volume ≤ SMA(10)
• ✅ Detects and labels spike levels:
• 🔶2x — Volume > 2x SMA(10)
• 🟢3x — Volume > 3x SMA(10)
• 🔴4x — Volume > 4x SMA(10)
• ✅ Built-in alerts for all 3 spike levels
---
📈 **Best Use Cases:**
• Confirm breakouts with strong volume
• Detect accumulation/distribution
• Filter low-volume setups
• Combine with VWAP/EMA for directional confirmation
---
⏱️ **Recommended Timeframes:**
• Intraday: 5m, 15m, 1h
• Also works on daily for swing trades
---
🧠 **Pro Tips:**
• Use with VWAP or EMA(20/50/200) for confluence
• Add SMA(Volume, 10) to your price chart for quick correlation
• Combine with candle pattern detection for signal validation
---

Time-Specific Volume AverageA volume indicator based on historic volume.
Checks for the average volume in the past few days at the same time of day. This helps you determine when there is truly volume in the markets.
We will see often see sustained volume above the average during a clear trend. If you see spikes in volume without it being sustained above the average, it is very likely that the trend will die off quickly.
This is very helpful in determining whether to trade based on a trend following system, or a range based system.
Settings are below:
Days to average: Number of days to look back(tradingview has limits depending on your plan)
SMA Length: Number of "volume averages" to look at. Keep this at 1 if you want the average volume at the exact moment in the day. If you increase it, will also average in the past few candles of "volume averages".
SMA Multiplier: Multiplies the SMA by this amount(helps to get higher quality trends)

Volume Spikes with EMA LabelVolume Spikes with EMA Label (by Emilio TRIUNFO)
Highlights significant volume surges by comparing real-time volume against a customizable EMA threshold multiplied by 1.5 (default).
Visually marks high-volume bars with colored labels on the chart to help identify strong market activity and trading opportunities.
Adjustable EMA length and multiplier allow flexibility for different strategies.

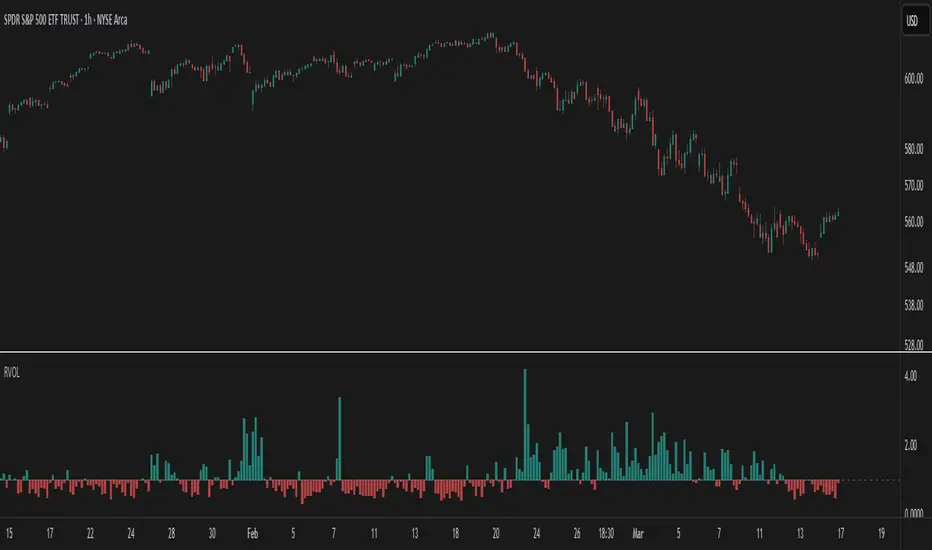
Relative Volume Indicator (RVOL)Relative Volume Indicator (RVOL) is a powerful tool designed for intraday traders who want to quickly identify key areas of interest based on relative volume activity.
This indicator compares the current candle’s volume with the historical average volume over a customizable lookback period (default is 20). It highlights when volume is:
🔴 Below average
🟡 Average
🟢 Above average
🟣 Extremely high
⚙️ Customizable Settings:
Lookback period for average volume
Volume thresholds (average, above average, extreme)
Custom colors for each volume zone
🎯 Best suited for:
Scalping strategies
Breakout confirmation
Volume-based entries at key support/resistance levels
Spotting unusual or algorithmic trading activity
📈 Works across all timeframes.
🎨 Fully customizable from the settings panel.
🔔 Alerts coming in future versions.

VWAP Adaptive (RelVol-Adjusted)This indicator provides an Adaptive VWAP that adjusts volume weighting using RelVol (Relative Volume at Time), offering a more accurate and context-aware price reference during sessions with irregular volume behavior.
Classic VWAP calculates the average price weighted by raw volume, without considering the time of day. This becomes a serious limitation during major market events such as CPI releases, FOMC announcements, NFP, or large-cap earnings. These events often trigger massive volume spikes within one or two candles. As a result, the classic VWAP gets pulled toward those extreme prices and becomes permanently skewed for the rest of the session.
In such conditions, classic VWAP becomes unreliable. It no longer reflects fair value and often misleads traders relying on it for dynamic support, resistance, or reversion signals.
This Adaptive VWAP improves on that by using RelVol, which compares the current volume to the average volume seen at the same time over previous sessions. It gives more weight to price when volume is typical for that moment, and adjusts the influence when volume is statistically abnormal. This reduces the impact of isolated volume spikes and stabilizes the VWAP path, even in high-volatility environments.
For example, on SPY 1-minute or 5-minute charts during a CPI release, a massive spike in volume and price can occur within a single candle. Classic VWAP will immediately anchor itself to that spike. Adaptive VWAP using RelVol softens that effect and maintains a more realistic trajectory.
Key features:
- Adaptive VWAP weighted by time-adjusted Relative Volume (RelVol)
- Designed to maintain VWAP reliability during macroeconomic events
- Flexible anchoring: Session, Week, Month, Quarter, Earnings, etc.
- Optional display of Classic VWAP for comparison
- Up to 3 customizable deviation bands (standard deviation or percentage)
This tool is ideal for intraday traders who need a VWAP that remains usable and unbiased, even in volatile sessions. It adds robustness to VWAP-based strategies by incorporating time-sensitive volume normalization.

VOL & AVG OverlayCustom Session Volume Versus Average Volume
Description:
This indicator will create an overlay on your chart that will show you the following information:
Custom Session Volume
Average For Selected Session
Percentage Comparison
Options:
Set Custom Time Frame For Calculations
Set Custom Time Frame For Average Comparison
Set Custom Time Zone
Enable / Disable Each Value
Change Text Color
Change Background Color
Change Table location
Example:
Set indicator to 30 period average. Set custom time frame to 9:30am to 10:30am Eastern/New York.
When the time frame for the calculation is closed , the indicator will provide a comparison of the current days volume compared to the average of 30 previous days for that same time frame and display it as a percentage in the table.
In this example you could compare how the first hour of the trading day compares to the previous 30 day's average, aiding in evaluating the potential volume for the remainder of the day.
Notes:
Times must be entered in 24 hour format. (1pm = 13:00 etc.)
This indicator is for Intra-day time frames, not > Day.
If you prefer data in this format as opposed to a plotted line, check out my other indicator: ADR & ATR Overlay

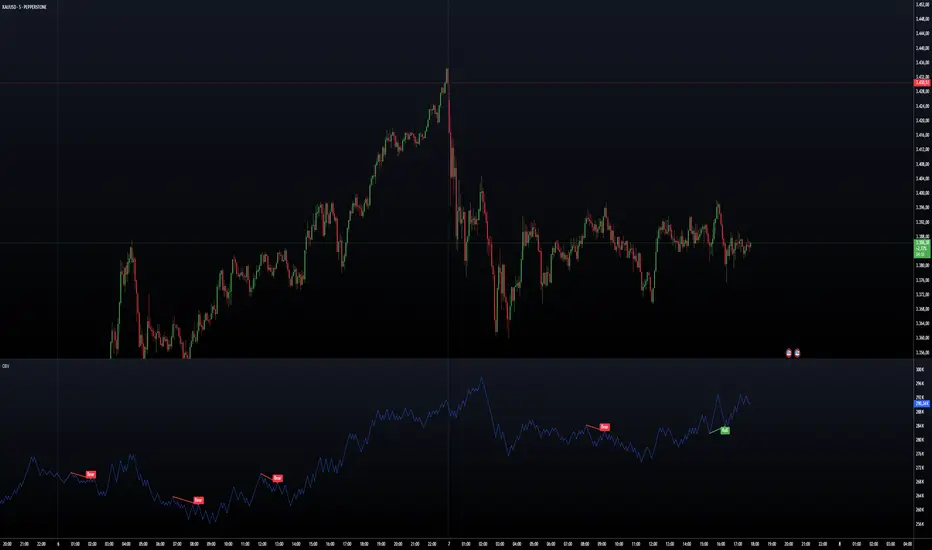
On Balance Volume W DivergenceOBV With Divergence Indicator
A comprehensive On Balance Volume (OBV) indicator enhanced with divergence detection capabilities.
Core Features:
Classic OBV calculation with volume-based price movement tracking
Advanced divergence detection system
Multiple smoothing options for OBV
Bollinger Bands integration
Technical Components:
Volume-based price movement analysis
Pivot point detection for divergence
Customizable lookback periods
Adjustable divergence range parameters
Customization Options:
Multiple Moving Average types (SMA, EMA, SMMA, WMA, VWMA)
Bollinger Bands with adjustable standard deviation
Divergence sensitivity settings
Visual customization for signals and alerts
The indicator combines traditional OBV analysis with modern divergence detection, offering traders a powerful tool for identifying potential trend reversals and market momentum shifts.
Key Parameters:
- Pivot Lookback Right/Left: 5 (default)
- Divergence Range: 5-60 bars
- MA Length: 14 (default)
- BB StdDev: 2.0 (default)
Alert System:
- Bullish divergence alerts
- Bearish divergence alerts
- Customizable alert messages
Note: The indicator requires volume data to function properly and will display an error if volume data is not available.
Volume Intelligence Suite (VIS) v2📊 Volume Intelligence Suite – Smart Volume, Smart Trading
The Volume Intelligence Suite is a powerful, all-in-one TradingView indicator designed to give traders deeper insight into market activity by visualizing volume behavior with price action context. Whether you're a scalper, day trader, or swing trader, this tool helps uncover hidden momentum, institutional activity, and potential reversals with precision.
🔍 Key Features:
Dynamic Volume Zones – Highlights high and low volume areas to spot accumulation/distribution ranges.
Volume Spikes Detector – Automatically marks abnormal volume bars signaling potential breakout or trap setups.
Smart Delta Highlighting – Compares bullish vs bearish volume in real time to reveal buyer/seller strength shifts.
Session-Based Volume Profiling – Breaks volume into key trading sessions (e.g., London, New York) for clearer context.
Volume Heatmap Overlay – Optional heatmap to show intensity and velocity of volume flow per candle.
Custom Alerts – Built-in alerts for volume surges, divergences, and exhaustion signals.
Optimized for Kill Zone Analysis – Pairs perfectly with ICT-style session strategies and Waqar Asim’s trading methods.
🧠 Why Use Volume Intelligence?
Most traders overlook the story behind each candle. Volume Intelligence Suite helps you "see the why behind the move" — exposing key areas of interest where smart money may be active. Instead of reacting late, this tool puts you in position to anticipate.
Use it to:
Validate breakouts
Detect fakeouts and liquidity grabs
Confirm bias during kill zones
Analyze volume divergence with price swings
⚙️ Fully Customizable:
From volume thresholds to visual styles and session timings, everything is user-adjustable to fit your market, timeframe, and strategy.
✅ Best For:
ICT/Smart Money Concepts (SMC) traders
Breakout & reversal traders
Kill zone session scalpers
Institutional footprint followers

Rogue ORB PRORogue ORB Pro is a precision-engineered Opening Range Breakout (ORB) indicator built for active intraday traders who need real signals, not noise.
This tool identifies high-probability breakout entries from the opening range, enhanced with optional ATR-based stop loss levels, deviation targets, cooldown filters, and a relative volume gate to filter weak setups.
🔍 Key Features:
Opening Range High/Low: Drawn from a user-defined time window and locked for the day
Deviations: Automatically plots target zones above and below the OR range (e.g. 1, 2 deviations)
Pre-Market Levels: Automatically draws pre market high and low lines at the end of pre market session
Buy/Sell Signals: Triggered on breakout of the OR High/Low with configurable breakout logic (touch or close)
ATR Stop Loss Line: Dynamically drawn at a fixed ATR distance from breakout candle, with optional SL label
Cooldown Period: Prevents back-to-back signals by enforcing a user-defined bar delay between entries, can help with overtrading
Volume Filter: Optional relative volume filter that requires breakout candles to exceed a custom volume threshold
VWAP Overlay: Visual VWAP for directional bias and confluence

RVOL Effort Matrix💪🏻 RVOL Effort Matrix is a tiered volume framework that translates crowd participation into structure-aware visual zones. Rather than simply flagging spikes, it measures each bar’s volume as a ratio of its historical average and assigns to that effort dynamic tiers, creating a real-time map of conviction , exhaustion , and imbalance —before price even confirms.
⚖️ At its core, the tool builds a histogram of relative volume (RVOL). When enabled, a second layer overlays directional effort by estimating buy vs sell volume using candle body logic. If the candle closes higher, green (buy) volume dominates. If it closes lower, red (sell) volume leads. These components are stacked proportionally and inset beneath a colored cap line—a small but powerful layer that maintains visibility of the true effort tier even when split bars are active. The cap matches the original zone color, preserving context at all times.
Coloration communicates rhythm, tempo, and potential turning points:
• 🔴 = structurally weak effort, i.e. failed moves, fake-outs or trend exhaustion
• 🟡 = neutral volume, as seen in consolidations or pullbacks
• 🟢 = genuine commitment, good for continuation, breakout filters, or early rotation signals
• 🟣 = explosive volume signaling either climax or institutional entry—beware!
Background shading (optional) mirrors these zones across the pane for structural scanning at a glance. Volume bars can be toggled between full-stack mode or clean column view. Every layer is modular—built for composability with tools like ZVOL or OBVX Conviction Bias.
🧐 Ideal Use-Cases:
• 🕰 HTF bias anchoring → LTF execution
• 🧭 Identifying when structure is being driven by real crowd pressure
• 🚫 Fading green/fuchsia bars that fail to break structure
• ✅ Riding green/fuchsia follow-through in directional moves
🍷 Recommended Pairings:
• ZVOL for statistically significant volume anomaly detection
• OBVX Conviction Bias ↔️ for directional confirmation of effort zones
• SUPeR TReND 2.718 for structure-congruent entry filtering
• ATR Turbulence Ribbon to distinguish expansion pressure from churn
🥁 RVOL Effort Matrix is all about seeing—how much pressure is behind a move, whether that pressure is sustainable, and whether the crowd is aligned with price. It's volume, but readable. It’s structure, but dynamic. It’s the difference between obeying noise and trading to the beat of the market.

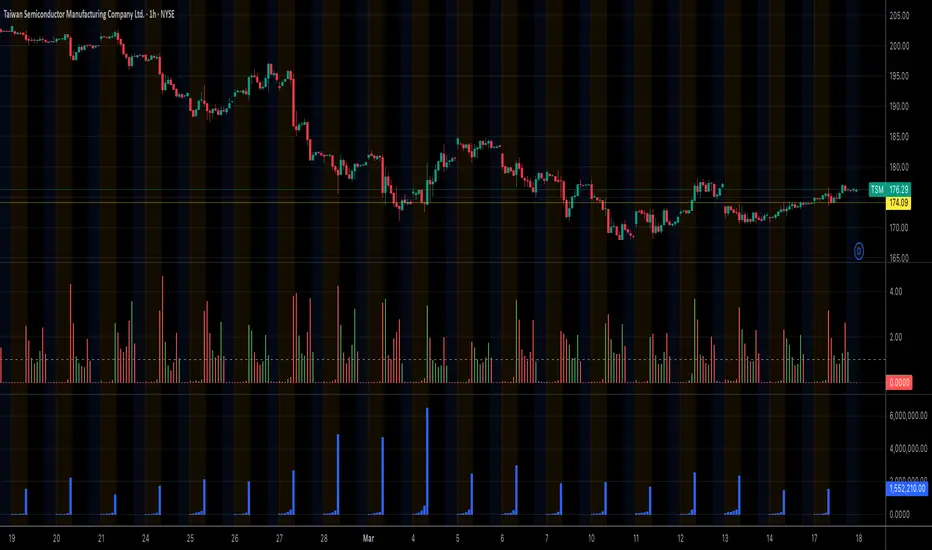
Triple EMA + Volume/Price SignalsOverview
This script merges three exponential moving averages (EMA) with adaptive volume thresholds to identify high-confidence trends. Unlike basic volume indicators, it triggers signals only when volume exceeds both a user-defined absolute value (e.g., 500k) and a percentage increase (e.g., 5%) – reducing noise in volatile markets.
Key Features
Triple EMA System:
Short (9), Medium (21), and Long (50) EMAs for trend direction.
Bullish Signal: Short EMA > Medium EMA > Long EMA.
Bearish Signal: Short EMA < Medium EMA < Long EMA.
Dual-Threshold Volume Confirmation:
Absolute Volume: Highlight bars where volume exceeds X (e.g., 500,000).
Percentage Increase: Highlight bars where volume rises by Y% (e.g., 5%) vs. prior bar.
Users can enable/disable either threshold.
Customizable Alerts:
Trigger alerts only when both EMA alignment and volume conditions are met.
How It Works
Trend + Volume Synergy:
A bullish EMA crossover alone might be a false breakout. This script requires additional volume confirmation (e.g., 500k volume + 5% spike) to validate the move.
Flexibility: Adjust thresholds for different assets:
Stocks: Higher absolute volume (e.g., 1M shares).
Crypto: Smaller absolute volume but larger % spikes (e.g., 10%).
Usage Examples
Swing Trading:
Set EMA lengths to 20/50/200 and volume thresholds to 500k + 5% on daily charts.
Scalping:
Use 5/13/21 EMAs with 100k volume + 3% spikes on 5-minute charts.

Premarket VolumeTimeframe: Use on intraday charts (e.g., 1-minute, 5-minute) with extended hours enabled.
Behavior: The plot will appear at 4:00 AM, grow as volume accumulates, and disappear at 9:30 AM each day.
Relative Volume at TimeThe Relative Volume at Time indicator (RVOL) is a simple modification of the original Relative Volume at Time script available in TradingView’s public library. It doesn’t change how the indicator works but includes two small adjustments:
Added Color Options – The ability to customize the colors of the volume bars, which was important to me as I use this indicator all the time and wanted more visually suitable colors.
Renamed Short Title – The abbreviation "RVOL" replaces "RelVol", as it's a more commonly used term in trading.
Aside from these small tweaks, the indicator retains all of its original functionality, including the ability to set an anchor timeframe, choose between Regular and Cumulative volume calculation modes, and adjust unconfirmed volume for incomplete bars.
This version exists simply because I needed a more personalized display for an indicator that I rely on daily.
How It Works
The Relative Volume at Time indicator compares the current volume to the average volume at the same time in previous sessions. This helps determine if today’s activity is higher or lower than usual.
Examples
On a daily chart (1D timeframe, length = 10), each volume bar compares today's volume to the average volume at the same time over the last 10 days. If today’s volume is higher than usual at this moment, the bar will reflect that.
On an hourly chart (1H timeframe, length = 5), each hourly volume bar compares the current hour’s volume to the same hour in the past 5 days. If the 10 AM bar is high, it means today's 10 AM volume is greater than the average of the past 5 sessions at 10 AM.
On a weekly chart (1W timeframe, length = 8), the indicator compares this week’s volume to the average of the last 8 weeks. A higher bar means this week is seeing significantly more volume than usual.
This logic applies to any timeframe. It always compares the current volume to past volumes at the same point in time.
@Julien_Eche
Valorous VolumesIndicator to mark the significant Volumes:
HVE: Checks if the current volume sets a new overall record.
HVY: Checks if the current volume equals the highest volume over the past one year.
HVQ: Checks if the current volume equals the highest volume over the past three months.

Zanger Volume Ratio (ZVR)Zanger Volume Ratio (ZVR)
Credits:
Most of the underlying code and logic in this script have been adapted from the work originally published by The_Peaceful_Lizard
Overview
The Zanger Volume Ratio (ZVR) is a powerful indicator designed to reveal market dynamics by comparing current cumulative volume to an average determined over a historical look-back period. It uses the concept of relative volume to not only highlight unusual volume spikes, but also uses color to illustrate how today's trading compares to typical levels. This unique method of volume analysis was popularized by Dan Zanger - a trader known for turning $10,775 into $18,000,000 in less than two years - by identifying key shifts in market interest and volume behavior.
Key Features
Volume Pacing Analysis:
The script calculates a volume delta by comparing the cumulative volume at any given moment to an average derived over a user-defined lookback period (Default 20-day). The resulting percentage difference offers a clear visualization and insight into unusual volume activity.
Dynamic Visual Representation:
Choose between either “Columns” or “Area” plot styles to display the percent difference. Additionally, you have the option to switch between a standard plot or a background color display, with customizable transparency, ensuring the indicator fits seamlessly with your chart’s aesthetics.
Dashboard Integration:
A simple dashboard table is displayed on the chart, showcasing the current ZVR value in real-time. With user-configurable position, text size, alignment, and color options, this feature ensures that the key metric is always visible and easy to interpret.
Why Use the Zanger Volume Ratio?
The ZVR is more than just a volume indicator. It acts as a window into market sentiment by highlighting days when trading interest intensifies. Many traders believe that an unusually high volume ratio may confirm trend strength or signal a reversal, making the indicator a valuable tool when used in conjunction with other technical analysis methods.
Whether you’re monitoring stocks, commodities, or forex markets, the Zanger Volume Ratio offers an accessible yet sophisticated method to decode volume dynamics. Its practical design and real-time visual feedback provide traders of all experience levels with critical data to spot high-potential setups.
Chart Description
First Pane: normal Volume Indicator on the foreground, ZVR as Background colors
Second Pane: ZVR Indicator with Column Style (default)
First panel: normal volume indicator in foreground, ZVR as background colors
Second panel: ZVR indicator with column style (default)
Note: This indicator is intended for use on intraday charts only!

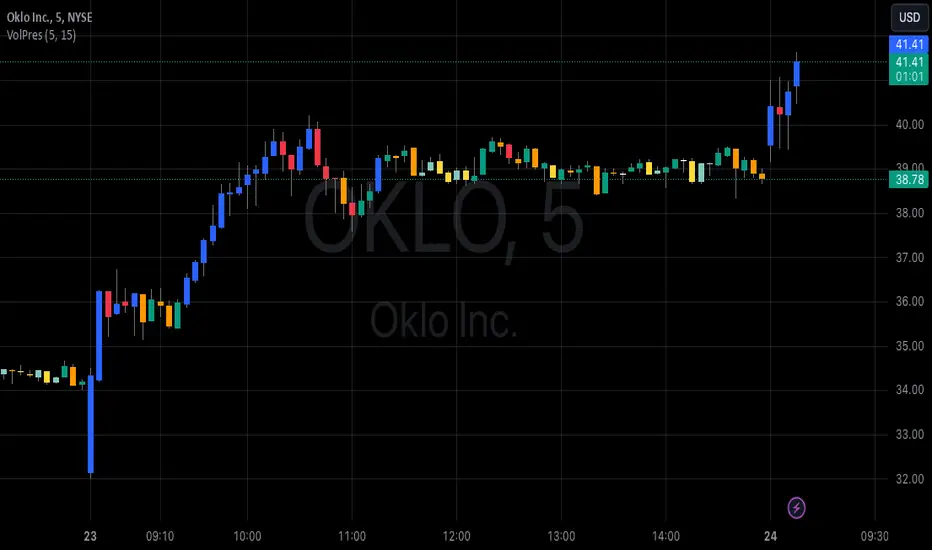
Volume PressureDraws the candle chart with colors to represent low, medium and high volumes. You get 3 colors for downward and 3 colors for upward movement. This will aid with immediately seeing the relative volume pushing the stock candle in the direction of movement.
You can control the percentage threshold for low and high volume. You also can change the colors to represent each volume level for upward and downward movement.
ICT Dealing RangeICT Dealing Range
This indicator identifies and plots ICT (Inner Circle Trader) Dealing Ranges - key institutional areas where smart money accumulates or distributes positions before significant moves.
What is a Dealing Range?
A Dealing Range is a significant price area where institutional traders accumulate or distribute their positions. These ranges form through a specific sequence of price movements that indicate institutional order flow:
Bullish Dealing Range Sequence:
1. Initial High (H)
2. Initial Low (L)
3. Higher High (HH)
4. Lower Low (LL)
5. Break above HH (confirmation)
Bearish Dealing Range Sequence:
1. Initial Low (L)
2. Initial High (H)
3. Lower Low (LL)
4. Higher High (HH)
5. Break below LL (confirmation)
My Trading Strategy
Entry Methods:
1. Range Extreme Retests:
- After range formation, wait for price to return to either extreme
- Long entries at range bottom with stops below
- Short entries at range top with stops above
2. Mid-Line Strategy:
- Use the mid-line as a pivot point for reversals
- Long entries on mid-line bounce with stops below
- Short entries on mid-line rejection with stops above
Stop Loss Placement:
- When entering at extremes: Place stops beyond the mid
- When entering at mid-line: Place stops beyond the opposing extreme
- Always respect the structure's boundaries
Take Profit Targets:
- Minimum 2:1 Risk-Reward ratio
- For extreme entries: Target the opposite extreme
- For mid-line entries: Target the nearest extreme
Risk Management
- Never enter without a clear invalidation point
- Maintain minimum 2:1 RR ratio
- Consider market structure and higher timeframe context
Indicator Features
- Auto-detection of dealing range patterns
- Color-coded boxes (green for bullish, red for bearish)
- Optional mid-line display
- Customizable colors and styles
- Adjustable pivot lookback periods
Notes
This tool is based on ICT concepts but should be used in conjunction with other forms of analysis. The dealing range provides a framework for understanding institutional order flow, but proper risk management and market context are essential for successful trading.
Remember: The best trades often come from clean retests of these ranges after their initial formation. Patience in waiting for proper setups is key to successful implementation.

5x Volume indicator - Day Trading5x Volume Screener - Day Trading
Version: 6.0
Description:
This indicator is designed to identify significant volume spikes in crypto and stock markets,
specifically targeting instances where volume exceeds 5x the average of a 10-period Simple Moving Average (SMA) as the baseline.
Perfect for day traders and momentum traders looking for high-volume breakout opportunities.
Key Features:
Tracks real-time volume compared to 5-period moving average
Visual alerts through green histogram bars for 5x volume spikes
Dynamic volume ratio display showing exact multiple of average volume
Clear threshold line for quick reference
Optional labels showing precise volume ratios
Benefits:
Instantly spot unusual volume activity
Identify potential breakout opportunities
Validate price movements with volume confirmation
Perfect for day trading and scalping
Works across multiple timeframes
Best Used For:
Day trading setups
Breakout trading
Volume confirmation
Momentum trading
Market reversal identification
Created by: CigarSavant
Last Updated: December 2024

Numerical Volume with Bullish/Bearish Color CodingDescription: This indicator visually represents trading volume with color-coded lines to distinguish between bullish and bearish market conditions. The volume line is colored green for bullish periods (when the closing price is higher than the opening price), red for bearish periods (when the closing price is lower than the opening price), and gray for neutral periods (when the open and close prices are equal). The volume can be displayed with labels at specified intervals, offering a quick reference to the exact volume for each period. This tool helps to analyze volume trends in relation to price action, providing an easy-to-read overview of market sentiment.

BuySell%_ImtiazH_v2BuySell%_ImtiazH
This indicator includes two powerful volume metrics to complement your trading analysis:
30-Day Avg Vol (Blue Line): Tracks the average volume over the past 30 days, providing a baseline for typical trading activity.
Breakout Vol (White Line): Highlights the volume threshold needed for a potential breakout, calculated as a user-defined percentage above the 30-day average volume (default: 40%).
In addition to these enhancements, the indicator breaks down total trading volume into buying and selling components and calculates the percentage of buy volume for each bar.
🟥 Red Bars: Represent total volume.
🟩 Teal Bars: Show the buying volume within each candle.
🟨 Buy %: Displays the percentage of buy volume dynamically in the indicator panel, highlighted in yellow for quick visibility.
Use this tool to easily spot accumulation (buying pressure) or distribution (selling pressure) trends, customize breakout thresholds, and identify key breakout opportunities. Simple, clear, and effective for volume-based analysis!
How Are Buy Volume and Sell Volume Calculated?
This indicator uses a proportional approach to estimate buy and sell volumes based on price action:
Buy Volume: The portion of total volume where the price is moving upward, representing trades executed at the ask price.
Formula:
Buy Volume = (close - low) / (high - low) * volume
Sell Volume: The portion of total volume where the price is moving downward, representing trades executed at the bid price.
Formula:
Sell Volume = (high - close) / (high - low) * volume
If the high and low prices are the same (flat bar), both buy and sell volumes are set to 0.
Why This Matters
This calculation assumes the close price’s position within the high-to-low range reflects the balance of buying and selling activity:
Close near the high: Most volume is buy volume.
Close near the low: Most volume is sell volume.
Close in the middle: Volume is split between buying and selling.
By breaking down volume in this way, the indicator helps traders identify key trends like accumulation (buying pressure) and distribution (selling pressure), making it a powerful tool for volume-based analysis.
