INVITE-ONLY SCRIPT
已更新 TWA - HTF Candle Color
Overview:
This indicator is designed to assist trend traders by confirming the market's direction on a higher timeframe and providing overlays to determine the strength and longevity of the current trend. Its goal is to help traders develop a probability-based mindset, enabling them to remain in profitable trades for longer periods and to identify when the trend might be shifting.

Main features and how to use:
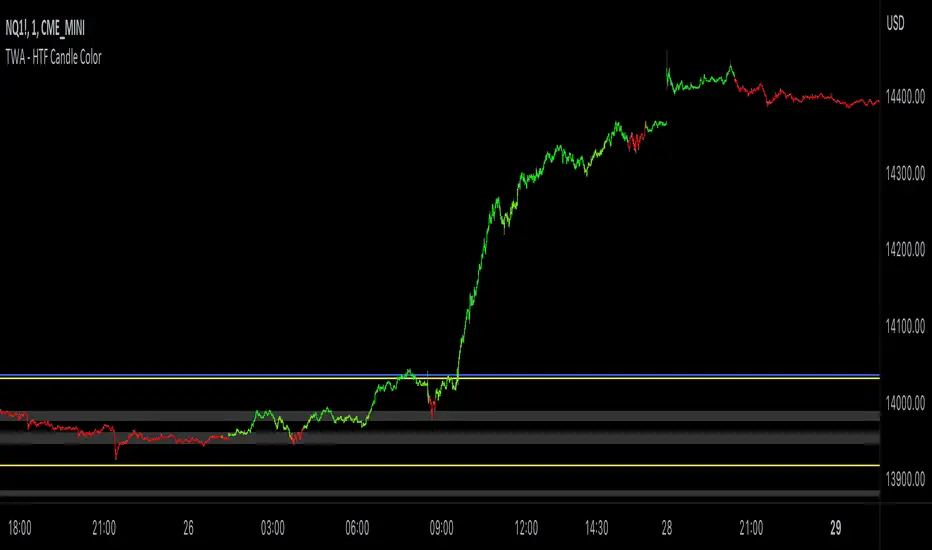
The main feature of the indicator is the green and red coloring of the candles. The candles can be used to determine market direction and use that bias to pick a trading direction. The contrarian candle overlay is another useful feature that helps trend traders identify potential trend reversals. To use this feature, traders should wait until the overlay candle coloring "clicks off" to determine the probability that the current move has reached its peak or bottom and to look for a larger retracement. The unique flexibility of this feature allows trend traders to see both sides of the story.

Calculations and what makes this original:
- It finds breaks of common fibonacci retracement and extension values on a higher time frame using my proprietary williams % R indicator to find
trend direction
- To help add more confirmation to trend direction the proprietary algorithm combines the above fibonacci breaks with confirmation from price
breaking beyond multiple deviations measured from bollinger bands.
- From your current charts timeframe it automatically calculates which higher timeframe to analyze.
- The above algorithm from the higher timeframe is distilled down to a green or red candle color on the chart to show market direction.
- It uses a blend of rsi and CCI to calculate contrarian candle coloring to show trend exhaustion.

Additional features
Contrarian candle coloring:
The contrarian candle coloring feature is designed to help trend traders see possible reversals. It overlays a different candle color on top of the HTF candles at certain periods. The unique feature of this addition is its ability to transform a trend-following indicator into a tops and bottom reversion indicator all in one. This flexibility allows traders to see both the contrarian and trend-following perspectives.

Enhanced probability:
This feature helps traders determine the probability of their potential trades long-running potential by changing the background color to green or red. Traders can use this information to help define their risk per trade. For example, if the candle coloring matches the background color, they might choose a long-running move, whereas if the candle coloring does not match the background color, they might opt for a scalping trade. The unique feature of this addition is how it gives traders the ability to view the market from different perspectives all on one screen.
Use Alternate Symbol:
Allows for the candle color to be derived from a separate symbol than the current chart .
Candle Color as Line:
Plots a line across the top or bottom of the chart showing the current color which allows users the ability to use an additional indicator that colors candles.
Contrarian Color as Line:
Plots a line across the top or bottom of the chart showing the current candle color which allows users the ability to use an additional indicator that colors candles.
Candle Color as Background:
Colors the chart background the color of the current HTF candle color which allows users the ability to use an additional indicator that colors candles.
Increase Market Sensitivity:
Quickens the response time for candles to change color which can be helpful for scalping on 1 minute charts.
ALERTS
- Get an alert when the candle color changes to green or red
-Get an alert when the enhanced probability color changes to green or red
-Get an alert when the candle color and enhanced probability color align green or red
This indicator is designed to assist trend traders by confirming the market's direction on a higher timeframe and providing overlays to determine the strength and longevity of the current trend. Its goal is to help traders develop a probability-based mindset, enabling them to remain in profitable trades for longer periods and to identify when the trend might be shifting.
Main features and how to use:
The main feature of the indicator is the green and red coloring of the candles. The candles can be used to determine market direction and use that bias to pick a trading direction. The contrarian candle overlay is another useful feature that helps trend traders identify potential trend reversals. To use this feature, traders should wait until the overlay candle coloring "clicks off" to determine the probability that the current move has reached its peak or bottom and to look for a larger retracement. The unique flexibility of this feature allows trend traders to see both sides of the story.
Calculations and what makes this original:
- It finds breaks of common fibonacci retracement and extension values on a higher time frame using my proprietary williams % R indicator to find
trend direction
- To help add more confirmation to trend direction the proprietary algorithm combines the above fibonacci breaks with confirmation from price
breaking beyond multiple deviations measured from bollinger bands.
- From your current charts timeframe it automatically calculates which higher timeframe to analyze.
- The above algorithm from the higher timeframe is distilled down to a green or red candle color on the chart to show market direction.
- It uses a blend of rsi and CCI to calculate contrarian candle coloring to show trend exhaustion.
Additional features
Contrarian candle coloring:
The contrarian candle coloring feature is designed to help trend traders see possible reversals. It overlays a different candle color on top of the HTF candles at certain periods. The unique feature of this addition is its ability to transform a trend-following indicator into a tops and bottom reversion indicator all in one. This flexibility allows traders to see both the contrarian and trend-following perspectives.
Enhanced probability:
This feature helps traders determine the probability of their potential trades long-running potential by changing the background color to green or red. Traders can use this information to help define their risk per trade. For example, if the candle coloring matches the background color, they might choose a long-running move, whereas if the candle coloring does not match the background color, they might opt for a scalping trade. The unique feature of this addition is how it gives traders the ability to view the market from different perspectives all on one screen.
Use Alternate Symbol:
Allows for the candle color to be derived from a separate symbol than the current chart .
Candle Color as Line:
Plots a line across the top or bottom of the chart showing the current color which allows users the ability to use an additional indicator that colors candles.
Contrarian Color as Line:
Plots a line across the top or bottom of the chart showing the current candle color which allows users the ability to use an additional indicator that colors candles.
Candle Color as Background:
Colors the chart background the color of the current HTF candle color which allows users the ability to use an additional indicator that colors candles.
Increase Market Sensitivity:
Quickens the response time for candles to change color which can be helpful for scalping on 1 minute charts.
ALERTS
- Get an alert when the candle color changes to green or red
-Get an alert when the enhanced probability color changes to green or red
-Get an alert when the candle color and enhanced probability color align green or red
發行說明
- Instead of the %'s pulled automatically now the user can turn that off and select the timeframe to pull from.
發行說明
- update to the internal code to allow an external source.
僅限邀請腳本
僅作者批准的使用者才能訪問此腳本。您需要申請並獲得使用許可,通常需在付款後才能取得。更多詳情,請依照作者以下的指示操作,或直接聯絡TradingwithAdamT_W_A。
TradingView不建議在未完全信任作者並了解其運作方式的情況下購買或使用腳本。您也可以在我們的社群腳本中找到免費的開源替代方案。
作者的說明
Please visit https://www.tradingwithadam.com/ if you would like to purchase or have questions.
免責聲明
這些資訊和出版物並非旨在提供,也不構成TradingView提供或認可的任何形式的財務、投資、交易或其他類型的建議或推薦。請閱讀使用條款以了解更多資訊。