OPEN-SOURCE SCRIPT
Dynamic Momentum Oscillator with Adaptive Thresholds

Dynamic Momentum Oscillator with Adaptive Thresholds (DMO-AT)
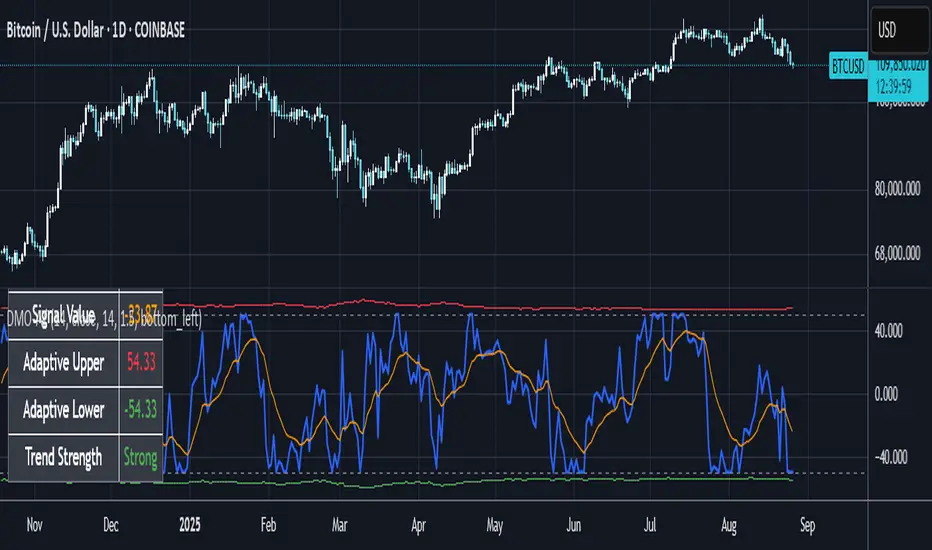
This advanced indicator is designed to provide traders with a robust tool for identifying momentum shifts, overbought/oversold conditions, and potential reversals in any market. Unlike traditional oscillators with fixed thresholds, DMO-AT uses adaptive levels that adjust based on current volatility (via ATR) and incorporates volume weighting for more accurate signals in high-volume environments.
#### Key Features:
- **Momentum Calculation**: A normalized momentum value derived from price changes, optionally weighted by volume for enhanced sensitivity.
- **Adaptive Thresholds**: Overbought and oversold levels dynamically adjust using ATR, making the indicator adaptable to volatile or ranging markets.
- **Signal Line**: An EMA of the momentum for crossover signals, helping confirm trend directions.
- **Divergence Detection**: Built-in alerts for bullish and bearish divergences between price and momentum.
- **Visual Enhancements**: Background coloring for quick zone identification, dashed static lines for reference, and a customizable stats table displaying real-time values.
- **Alerts**: Multiple alert conditions for crossovers, zone entries, and divergences to keep you notified without constant chart watching.
#### How to Use:
1. Add the indicator to your chart via TradingView's indicator search.
2. Customize inputs: Adjust the momentum length, source, ATR length, and threshold multiplier to fit your trading style (e.g., shorter lengths for scalping, longer for swing trading).
3. Interpret Signals:
- **Crossover**: Momentum crossing above the signal line suggests bullish momentum; below indicates bearish.
- **Zones**: Entering the overbought (red) zone may signal a potential sell; oversold (green) for buys.
- **Divergences**: Use alerts to spot hidden opportunities where price and momentum disagree.
4. Combine with other tools like moving averages or support/resistance for confluence.
5. Enable the stats table for at-a-glance insights on the chart.
This indicator is versatile across timeframes and assets, from stocks to crypto. It's optimized for clarity and performance, with no repainting.
開源腳本
秉持TradingView一貫精神,這個腳本的創作者將其設為開源,以便交易者檢視並驗證其功能。向作者致敬!您可以免費使用此腳本,但請注意,重新發佈代碼需遵守我們的社群規範。
Software Engineer and FX, Options, Crypto Trader. Previously worked at large options market maker. If you like my scripts and would like to donate:
Bitcoin: 179ETrGo3FCVcnBV8i1uc4J8YHFRknYytz
Eth: 0x73d59A8214FD70053aF37E9700692e25de441245
Bitcoin: 179ETrGo3FCVcnBV8i1uc4J8YHFRknYytz
Eth: 0x73d59A8214FD70053aF37E9700692e25de441245
免責聲明
這些資訊和出版物並非旨在提供,也不構成TradingView提供或認可的任何形式的財務、投資、交易或其他類型的建議或推薦。請閱讀使用條款以了解更多資訊。