OPEN-SOURCE SCRIPT
已更新 RBF Kijun Trend System [InvestorUnknown]

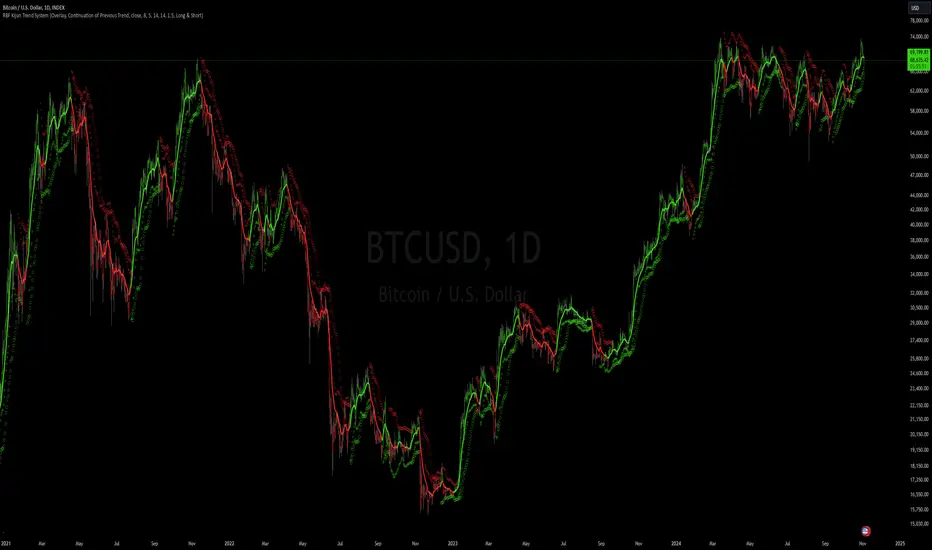
The RBF Kijun Trend System utilizes advanced mathematical techniques, including the Radial Basis Function (RBF) kernel and Kijun-Sen calculations, to provide traders with a smoother trend-following experience and reduce the impact of noise in price data. This indicator also incorporates ATR to dynamically adjust smoothing and further minimize false signals.
Radial Basis Function (RBF) Kernel Smoothing
Pine Script®
Pine Script®
Kijun-Sen Calculation
Pine Script®
ATR-Adjusted RBF and Kijun-Sen
Neutral State and Trend Continuation
Pine Script®

Visual difference between "Neutral" (Bottom) and "Continuation of Previous Trend" (Top). Click on the picture to see it in full size.
Customizable Inputs and Settings:
Backtesting and Performance Metrics
The indicator includes a Backtest Mode, allowing users to evaluate the performance of the strategy using historical data. In Backtest Mode, a performance metrics table is generated, comparing the strategy's results to a simple buy-and-hold approach. Key metrics include mean returns, standard deviation, Sharpe ratio, and more.
Alerts
To keep traders informed, the indicator supports alerts for significant trend shifts:
Pine Script®
Important Notes
Radial Basis Function (RBF) Kernel Smoothing
- The RBF kernel is a mathematical method used to smooth the price series. By calculating weights based on the distance between data points, the RBF kernel ensures smoother transitions and a more refined representation of the price trend.
- The RBF Kernel Weighted Moving Average is computed using the formula:
f_rbf_kernel(x, xi, sigma) =>
math.exp(-(math.pow(x - xi, 2)) / (2 * math.pow(sigma, 2)))
- The smoothed price is then calculated as a weighted sum of past prices, using the RBF kernel weights:
f_rbf_weighted_average(src, kernel_len, sigma) =>
float total_weight = 0.0
float weighted_sum = 0.0
// Compute weights and sum for the weighted average
for i = 0 to kernel_len - 1
weight = f_rbf_kernel(kernel_len - 1, i, sigma)
total_weight := total_weight + weight
weighted_sum := weighted_sum + (src * weight)
// Check to avoid division by zero
total_weight != 0 ? weighted_sum / total_weight : na
Kijun-Sen Calculation
- The Kijun-Sen, a component of Ichimoku analysis, is used here to further establish trends. The Kijun-Sen is computed as the average of the highest high and the lowest low over a specified period (default: 14 periods).
- This Kijun-Sen calculation is based on the RBF-smoothed price to ensure smoother and more accurate trend detection.
f_kijun_sen(len, source) =>
math.avg(ta.lowest(source, len), ta.highest(source, len))
ATR-Adjusted RBF and Kijun-Sen
- To mitigate false signals caused by price volatility, the indicator features ATR-adjusted versions of both the RBF smoothed price and Kijun-Sen.
- The ATR multiplier is used to create upper and lower bounds around these lines, providing dynamic thresholds that account for market volatility.
Neutral State and Trend Continuation
- This indicator can interpret a neutral state, where the signal is neither bullish nor bearish. By default, the indicator is set to interpret a neutral state as a continuation of the previous trend, though this can be adjusted to treat it as a truly neutral state.
- Users can configure this setting using the signal_str input:
simple string signal_str = input.string("Continuation of Previous Trend", "Treat 0 State As", options = ["Neutral", "Continuation of Previous Trend"], group = G1)
Visual difference between "Neutral" (Bottom) and "Continuation of Previous Trend" (Top). Click on the picture to see it in full size.
Customizable Inputs and Settings:
- Source Selection: Choose the input source for calculations (open, high, low, close, etc.).
- Kernel Length and Sigma: Adjust the RBF kernel parameters to change the smoothing effect.
- Kijun Length: Customize the lookback period for Kijun-Sen.
- ATR Length and Multiplier: Modify these settings to adapt to market volatility.
Backtesting and Performance Metrics
The indicator includes a Backtest Mode, allowing users to evaluate the performance of the strategy using historical data. In Backtest Mode, a performance metrics table is generated, comparing the strategy's results to a simple buy-and-hold approach. Key metrics include mean returns, standard deviation, Sharpe ratio, and more.
- Equity Calculation: The indicator calculates equity performance based on signals, comparing it against the buy-and-hold strategy.
- Performance Metrics Table: Detailed performance analysis, including probabilities of positive, neutral, and negative returns.
Alerts
To keep traders informed, the indicator supports alerts for significant trend shifts:
// - - - - - ALERTS - - - - - //{
alert_source = sig
bool long_alert = ta.crossover (intrabar ? alert_source : alert_source[1], 0)
bool short_alert = ta.crossunder(intrabar ? alert_source : alert_source[1], 0)
alertcondition(long_alert, "LONG (RBF Kijun Trend System)", "RBF Kijun Trend System flipped ⬆LONG⬆")
alertcondition(short_alert, "SHORT (RBF Kijun Trend System)", "RBF Kijun Trend System flipped ⬇Short⬇")
//}
Important Notes
- Calibration Needed: The default settings provided are not optimized and are intended for demonstration purposes only. Traders should adjust parameters to fit their trading style and market conditions.
- Neutral State Interpretation: Users should carefully choose whether to treat the neutral state as a continuation or a separate signal.
- Backtest Results: Historical performance is not indicative of future results. Market conditions change, and past trends may not recur.
發行說明
Updated the code to pinescript v6, added backtesting library v2 with more backtesting functions and removed old backtesting functions from the code開源腳本
秉持TradingView一貫精神,這個腳本的創作者將其設為開源,以便交易者檢視並驗證其功能。向作者致敬!您可以免費使用此腳本,但請注意,重新發佈代碼需遵守我們的社群規範。
免責聲明
這些資訊和出版物並非旨在提供,也不構成TradingView提供或認可的任何形式的財務、投資、交易或其他類型的建議或推薦。請閱讀使用條款以了解更多資訊。
開源腳本
秉持TradingView一貫精神,這個腳本的創作者將其設為開源,以便交易者檢視並驗證其功能。向作者致敬!您可以免費使用此腳本,但請注意,重新發佈代碼需遵守我們的社群規範。
免責聲明
這些資訊和出版物並非旨在提供,也不構成TradingView提供或認可的任何形式的財務、投資、交易或其他類型的建議或推薦。請閱讀使用條款以了解更多資訊。