PROTECTED SOURCE SCRIPT
Volume Plus by YSTC
The script is available (for free) to YSTC's Course members of "Trading with PAV".
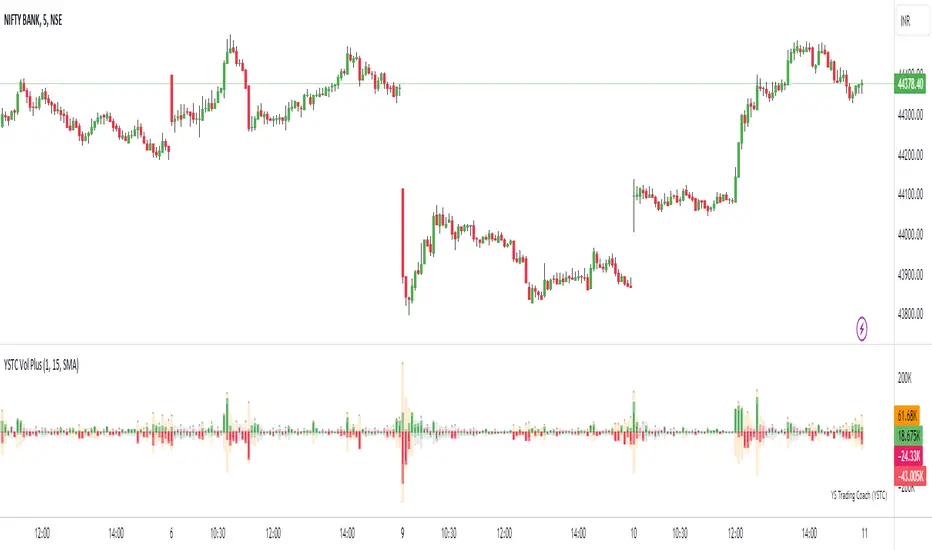
This script shows Bull Volume up and Bear Volume down with it delta shown with Green line for bull and Red line for bear.
Also on Index use Continuous Future Volume.
You can use the following timeframes even seconds.
["1S", "5S", "10S", "15S", "30S", "1", "2", "3", "5", "10", "15", "30", "45", "60", "120", "180", "240", "1D", "1W", "1M"]
Below shows the indicator on chart image.

It also show Cumulative Delta as shown in below chart.
Should be used on 1 min chart only.

Cumulative Delta Divergence
Price remains in sideways while Delta took hit as shown in below image.

After that price also followed.
Have Questions ?
contact@ystc.in
Free Stock Market Introduction Available.
Name: Yogesh Patil (YS Trading Coach).
Contact: +91 9637070868.
Time: Monday to Friday (10:00 AM - 07:00 PM).
This script shows Bull Volume up and Bear Volume down with it delta shown with Green line for bull and Red line for bear.
Also on Index use Continuous Future Volume.
You can use the following timeframes even seconds.
["1S", "5S", "10S", "15S", "30S", "1", "2", "3", "5", "10", "15", "30", "45", "60", "120", "180", "240", "1D", "1W", "1M"]
Below shows the indicator on chart image.
It also show Cumulative Delta as shown in below chart.
Should be used on 1 min chart only.
Cumulative Delta Divergence
Price remains in sideways while Delta took hit as shown in below image.
After that price also followed.
Have Questions ?
contact@ystc.in
Free Stock Market Introduction Available.
Name: Yogesh Patil (YS Trading Coach).
Contact: +91 9637070868.
Time: Monday to Friday (10:00 AM - 07:00 PM).
受保護腳本
此腳本以閉源形式發佈。 不過,您可以自由使用,沒有任何限制 — 點擊此處了解更多。
免責聲明
這些資訊和出版物並非旨在提供,也不構成TradingView提供或認可的任何形式的財務、投資、交易或其他類型的建議或推薦。請閱讀使用條款以了解更多資訊。
受保護腳本
此腳本以閉源形式發佈。 不過,您可以自由使用,沒有任何限制 — 點擊此處了解更多。
免責聲明
這些資訊和出版物並非旨在提供,也不構成TradingView提供或認可的任何形式的財務、投資、交易或其他類型的建議或推薦。請閱讀使用條款以了解更多資訊。