OPEN-SOURCE SCRIPT
已更新 Filtered DTR Table
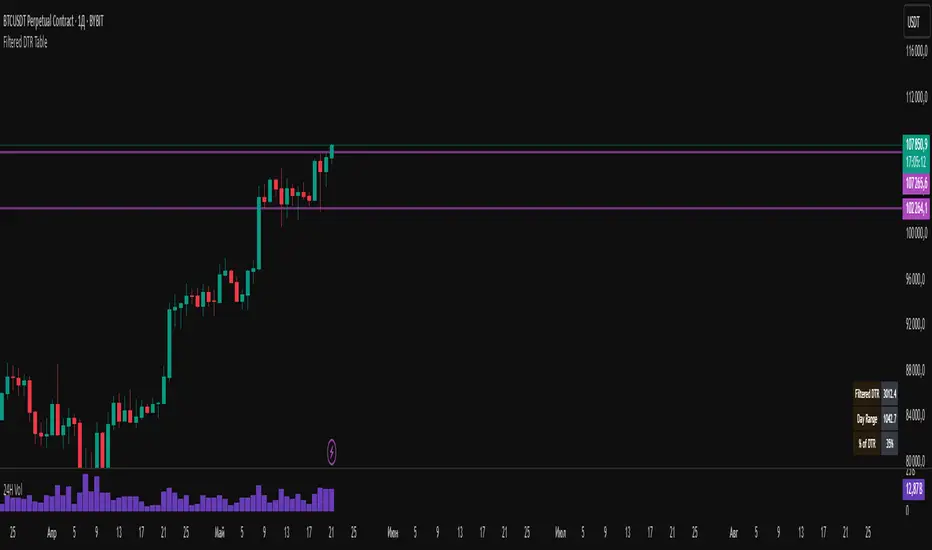
📊 Filtered Daily True Range (DTR) Indicator
This indicator calculates and displays a filtered version of the Daily True Range (DTR) over the last 14 trading days, using high and low prices of each day.
It filters out extreme values by excluding any daily range that is:
Less than 0.5× the average range
Greater than 2× the average range
The indicator shows a table in the bottom-right corner of the main chart, containing:
Filtered ATR – The average of valid (filtered) daily ranges over the past 14 days, based on the high-low difference.
Current Day's Range – The high-low range of the current trading day.
% of ATR – How much of the filtered ATR has been covered by today's range, expressed as a whole number percentage.
發行說明
DTR Whith out 2x. 0.5x dtr開源腳本
秉持TradingView一貫精神,這個腳本的創作者將其設為開源,以便交易者檢視並驗證其功能。向作者致敬!您可以免費使用此腳本,但請注意,重新發佈代碼需遵守我們的社群規範。
免責聲明
這些資訊和出版物並非旨在提供,也不構成TradingView提供或認可的任何形式的財務、投資、交易或其他類型的建議或推薦。請閱讀使用條款以了解更多資訊。
開源腳本
秉持TradingView一貫精神,這個腳本的創作者將其設為開源,以便交易者檢視並驗證其功能。向作者致敬!您可以免費使用此腳本,但請注意,重新發佈代碼需遵守我們的社群規範。
免責聲明
這些資訊和出版物並非旨在提供,也不構成TradingView提供或認可的任何形式的財務、投資、交易或其他類型的建議或推薦。請閱讀使用條款以了解更多資訊。