OPEN-SOURCE SCRIPT
ZigZag Bands
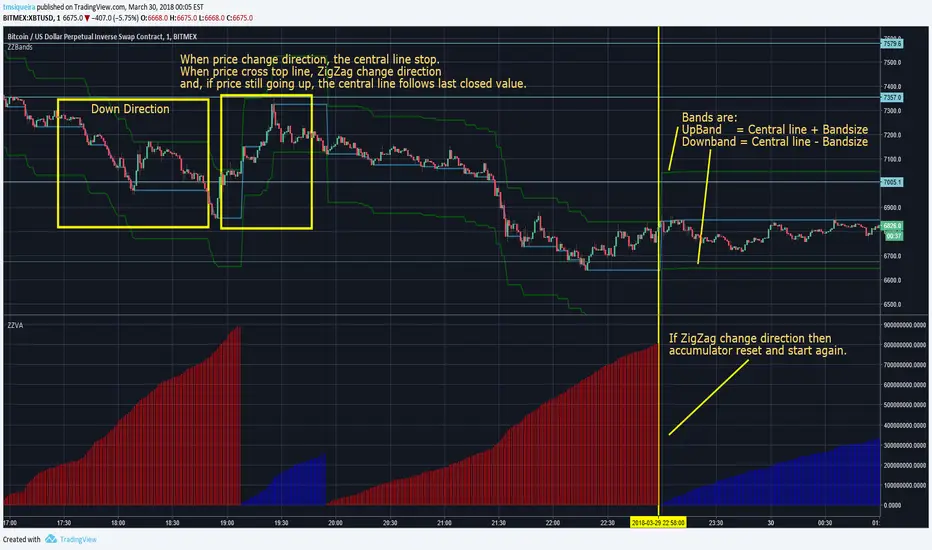
This script plots a central line and top and bottom lines, like a bands.
If the market is up and price still going up then central line follow the last closed "close" value.
If the market is up and price goes down, then central line stop change. If price still going down and cross bottom line, the direction changes and central line start to follow the close value if it is below central line.
I recommend to use Bandsize = 2 or 3 times ATR(300 or bigger)
This script is used in pair with my ZigZag Volume Accumulator, https://br.tradingview.com/script/Zplglw8b/
開源腳本
秉持TradingView一貫精神,這個腳本的創作者將其設為開源,以便交易者檢視並驗證其功能。向作者致敬!您可以免費使用此腳本,但請注意,重新發佈代碼需遵守我們的社群規範。
免責聲明
這些資訊和出版物並非旨在提供,也不構成TradingView提供或認可的任何形式的財務、投資、交易或其他類型的建議或推薦。請閱讀使用條款以了解更多資訊。
開源腳本
秉持TradingView一貫精神,這個腳本的創作者將其設為開源,以便交易者檢視並驗證其功能。向作者致敬!您可以免費使用此腳本,但請注意,重新發佈代碼需遵守我們的社群規範。
免責聲明
這些資訊和出版物並非旨在提供,也不構成TradingView提供或認可的任何形式的財務、投資、交易或其他類型的建議或推薦。請閱讀使用條款以了解更多資訊。