OPEN-SOURCE SCRIPT
已更新 Crossover EMMM
Crossover EMMM is an indicator that displays the Madrid Moving Averages (EMMM) and detects crossovers (upward crossings) and crossunders (downward crossings) between two moving averages. It uses two input parameters to define the fast and slow EMMM lengths. The script calculates the EMMM values, their changes, and assigns colors based on the change direction. The fast EMMM is plotted in green or red, and the slow EMMM is plotted in blue or red, depending on the change direction. The script also displays triangle shapes below or above the bars to indicate crossovers and crossunders.
The "Madrid Moving Average" (EMMMM) is a type of moving average used in technical analysis to smooth price fluctuations of financial assets, such as stocks or currency pairs. Unlike the Simple Moving Average (SMA), which treats all data equally, the EMMM gives more weight to recent data. This results in the EMMM responding more swiftly to price changes, making it well-suited for identifying short-term trends.
The "Madrid Moving Average" (EMMMM) is a type of moving average used in technical analysis to smooth price fluctuations of financial assets, such as stocks or currency pairs. Unlike the Simple Moving Average (SMA), which treats all data equally, the EMMM gives more weight to recent data. This results in the EMMM responding more swiftly to price changes, making it well-suited for identifying short-term trends.
發行說明
Crossover EMMM is an indicator that displays the Madrid Moving Averages (EMMM) and detects crossovers (upward crossings)
and crossunders (downward crossings) between two moving averages.
It uses two input parameters to define the fast and slow EMMM lengths.
The script calculates the EMMM values, their changes, and assigns colors based on the change direction.
The fast EMMM is plotted in green or red, and the slow EMMM is plotted in blue or red, depending on the change direction.
The script also displays triangle shapes below or above the bars to indicate crossovers and crossunders.
It also displays small triangles each time the two EMMMs returns in the same trend.
發行說明
Crossover EMMM is an indicator that displays the Madrid Moving Averages (EMMM) and detects crossovers (upward crossings) and crossunders (downward crossings) between two moving averages.It uses two input parameters to define the fast and slow EMMM lengths.
The script calculates the EMMM values, their changes, and assigns colors based on the change direction.
The fast EMMM is plotted in green or red, and the slow EMMM is plotted in blue or red, depending on the change direction.
The script also displays triangle shapes below or above the bars to indicate crossovers and crossunders.
發行說明
Crossover EMMM is an indicator that displays the Madrid Moving Averages (EMMM) and detects crossovers (upward crossings)and crossunders (downward crossings) between two moving averages.
It uses two input parameters to define the fast and slow EMMM lengths.
The script calculates the EMMM values, their changes, and assigns colors based on the change direction.
The fast EMMM is plotted in green or red, and the slow EMMM is plotted in blue or red, depending on the change direction.
The script also displays triangle shapes below or above the bars to indicate crossovers and crossunders.
It also displays little circles when the two Movign averages come back to the same color.
Updated 10.29.2023 : Offset option added.
Circles shapes replace little triangle shapes.
發行說明
Crossover EMMM is an indicator that displays the Madrid Moving Averages (EMMM) and detects crossovers (upward crossings)
and crossunders (downward crossings) between two moving averages.
It uses two input parameters to define the fast and slow EMMM lengths.
The script calculates the EMMM values, their changes, and assigns colors based on the change direction.
The fast EMMM is plotted in green or red, and the slow EMMM is plotted in blue or red, depending on the change direction.
The script also displays triangle shapes below or above the bars to indicate crossovers and crossunders.
It also displays little circles when the two Movign averages come back to the same color.
Updated 10.29.2023
Offset option added,
Circles shapes replace little triangles default shapes.
EMMM Plot shape line replaces stepline default shape.
發行說明
Crossover EMMM is an indicator that displays the Madrid Moving Averages (EMMM) and detects crossovers (upward crossings)and crossunders (downward crossings) between two moving averages.
It uses two input parameters to define the fast and slow EMMM lengths.
The script calculates the EMMM values, their changes, and assigns colors based on the change direction.
The fast EMMM is plotted in green or red, and the slow EMMM is plotted in blue or red, depending on the change direction.
The script also displays triangle shapes below or above the bars to indicate crossovers and crossunders.
It also displays little circles when the two Moving averages come back to the same color.
Updated 10.29.2023
Offset option added,
Circles shapes replace little triangles default shapes.
EMMM Plot shape line replaces stepline default shape.
Triangles and circles are sync with the crossovers and colors.
發行說明
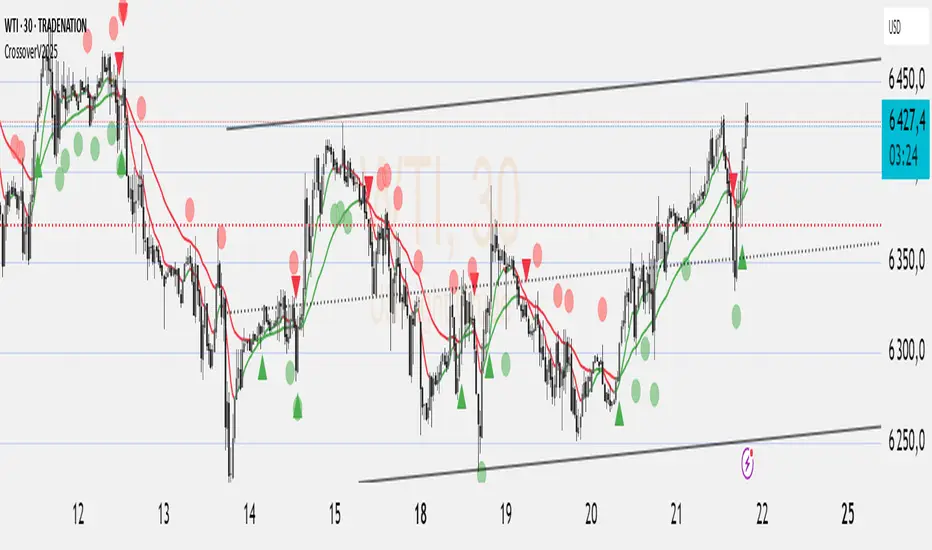
CrossoverV2025 is based on the Madrid Moving Averages (EMMM) and helps identify trend reversals across any market — forex, stocks, crypto, and more.🔹 The indicator displays two dynamic moving averages (fast and slow) that change color based on their direction:
Green = upward momentum (bullish)
Red = downward momentum (bearish)
🟢 Green triangle below the price = Buy signal ("BUY EMM")
🔴 Red triangle above the price = Sell signal ("SELL EMM")
🟡 Red circle above the bar = confirmed bearish reversal → "Point Sell"
🟢 Green circle below the bar = confirmed bullish reversal → "Point Buy"
🔔 Automatic Alerts:
"BUY EMM" / "SELL EMM" triggered on every crossover/crossunder
"Point Buy" / "Point Sell" when both moving averages turn green or red together after a trend change
💡 How to use:
Ideal for spotting early trend reversals. For best results, combine with other tools like RSI, support/resistance levels, or volume analysis to filter signals.
發行說明
CrossoverV2025 is based on the Madrid Moving Averages (EMMM) and helps identify trend reversals across any market — forex, stocks, crypto, and more.🔹 The indicator displays two dynamic moving averages (fast and slow) that change color based on their direction:
Green = upward momentum (bullish)
Red = downward momentum (bearish)
🟢 Green triangle below the price = Buy signal ("BUY EMM")
🔴 Red triangle above the price = Sell signal ("SELL EMM")
🟡 Red circle above the bar = confirmed bearish reversal → "Point Sell"
🟢 Green circle below the bar = confirmed bullish reversal → "Point Buy"
🔔 Automatic Alerts:
"BUY EMM" / "SELL EMM" triggered on every crossover/crossunder
"Point Buy" / "Point Sell" when both moving averages turn green or red together after a trend change
💡 How to use:
Ideal for spotting early trend reversals. For best results, combine with other tools like RSI, support/resistance levels, or volume analysis to filter signals.
開源腳本
秉持TradingView一貫精神,這個腳本的創作者將其設為開源,以便交易者檢視並驗證其功能。向作者致敬!您可以免費使用此腳本,但請注意,重新發佈代碼需遵守我們的社群規範。
免責聲明
這些資訊和出版物並非旨在提供,也不構成TradingView提供或認可的任何形式的財務、投資、交易或其他類型的建議或推薦。請閱讀使用條款以了解更多資訊。
開源腳本
秉持TradingView一貫精神,這個腳本的創作者將其設為開源,以便交易者檢視並驗證其功能。向作者致敬!您可以免費使用此腳本,但請注意,重新發佈代碼需遵守我們的社群規範。
免責聲明
這些資訊和出版物並非旨在提供,也不構成TradingView提供或認可的任何形式的財務、投資、交易或其他類型的建議或推薦。請閱讀使用條款以了解更多資訊。