INVITE-ONLY SCRIPT
Monte Carlo Simulation (200 Random Walks)
Understanding the Monte Carlo Simulation
This indicator uses Monte Carlo methods to predict the future price of a security using 200 random walks.
Monte Carlo methods rely on repeated random sampling to create a data set that has the same characteristics as the sample source, representing examples of alternate possible outcomes. The data set created using random sampling is called a “random walk”. Obtaining a mean from 200 random walks allows us to benchmark the performance of the source against the random walks obtained from the source.

Monte Carlo Utility
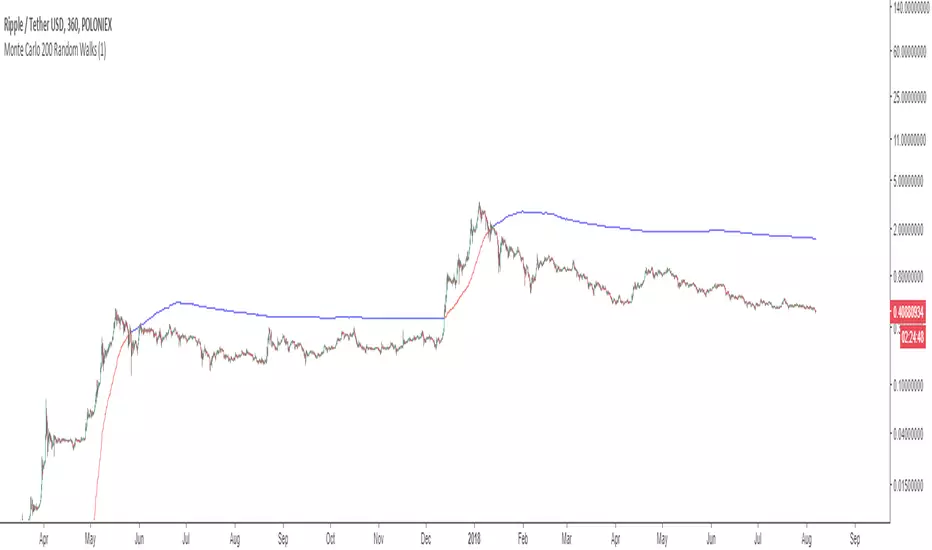
This Monte Carlo simulator plots a single line that represents 200 random walks across any security and time stamp. The line is red if most of the random walks are lower than the price of the security, and blue if the walks are higher.
Input Values
Select the “Format”, button located next to the indicator label to adjust the input values and the style.
The Monte Carlo indicator has only one user-defined input value that can be changed.
The Random_Variable determines set of random walks. If this variable is changed, it will run a fresh set
of 200 random walks which will result in a slightly different outcome. 200 random walks will load
relatively quick and produce roughly the same outcome as 10,000 random walks.
Adding the indicator to your chart multiple times using many different random variables will allow you
to achieve a more accurate reading.
For more information on this indicator view the PDF here: kenzing.com/product/monte-carlo-simulation-200-random-walks/
This indicator uses Monte Carlo methods to predict the future price of a security using 200 random walks.
Monte Carlo methods rely on repeated random sampling to create a data set that has the same characteristics as the sample source, representing examples of alternate possible outcomes. The data set created using random sampling is called a “random walk”. Obtaining a mean from 200 random walks allows us to benchmark the performance of the source against the random walks obtained from the source.
Monte Carlo Utility
This Monte Carlo simulator plots a single line that represents 200 random walks across any security and time stamp. The line is red if most of the random walks are lower than the price of the security, and blue if the walks are higher.
Input Values
Select the “Format”, button located next to the indicator label to adjust the input values and the style.
The Monte Carlo indicator has only one user-defined input value that can be changed.
The Random_Variable determines set of random walks. If this variable is changed, it will run a fresh set
of 200 random walks which will result in a slightly different outcome. 200 random walks will load
relatively quick and produce roughly the same outcome as 10,000 random walks.
Adding the indicator to your chart multiple times using many different random variables will allow you
to achieve a more accurate reading.
For more information on this indicator view the PDF here: kenzing.com/product/monte-carlo-simulation-200-random-walks/
僅限邀請腳本
僅作者批准的使用者才能訪問此腳本。您需要申請並獲得使用許可,通常需在付款後才能取得。更多詳情,請依照作者以下的指示操作,或直接聯絡GrantPeace。
TradingView不建議在未完全信任作者並了解其運作方式的情況下購買或使用腳本。您也可以在我們的社群腳本中找到免費的開源替代方案。
作者的說明
Kenzing trading indicators for TradingView perform advanced real-time analysis of stock price trends and display alerts that are easy for the average Trader to interpret.
kenzing.com
kenzing.com
免責聲明
這些資訊和出版物並非旨在提供,也不構成TradingView提供或認可的任何形式的財務、投資、交易或其他類型的建議或推薦。請閱讀使用條款以了解更多資訊。