OPEN-SOURCE SCRIPT
Cycle Oscillator
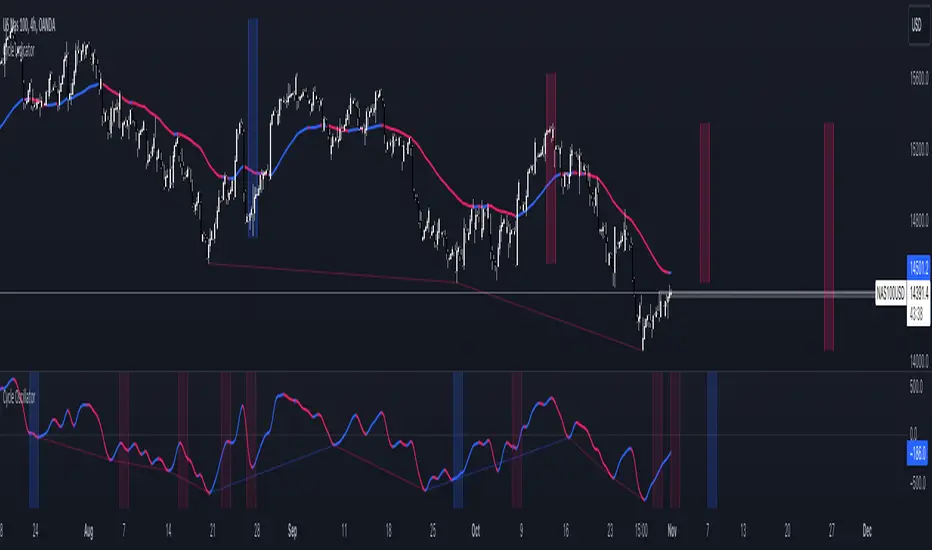
The Cycle Oscillator is a tool developed to help traders analyze market cycles thanks to a simplified version of the Hurst theory and the easy visualization provided by the detrended cycle.
This indicator has two functions:
- The first one is the plotting of a line that oscillates above and below the zero line, which can be used to find the cycle direction and momentum
- The second feature is the next-cycle bottom forecaster, useful for estimating the timing of the future pivot low based on the pivot low of the oscillator.
This last feature shows graphically the period in which the next low will probably happen, using as a calculation method the timing of the previous indicator's lows.
Additionally, the user can choose to modify the cycle length to analyze bigger or smaller price movements.
This indicator can be greatly used in combination with other Cycle Indicators to gain more confluence in the plotted time areas.
開源腳本
秉持TradingView一貫精神,這個腳本的創作者將其設為開源,以便交易者檢視並驗證其功能。向作者致敬!您可以免費使用此腳本,但請注意,重新發佈代碼需遵守我們的社群規範。
免責聲明
這些資訊和出版物並非旨在提供,也不構成TradingView提供或認可的任何形式的財務、投資、交易或其他類型的建議或推薦。請閱讀使用條款以了解更多資訊。
開源腳本
秉持TradingView一貫精神,這個腳本的創作者將其設為開源,以便交易者檢視並驗證其功能。向作者致敬!您可以免費使用此腳本,但請注意,重新發佈代碼需遵守我們的社群規範。
免責聲明
這些資訊和出版物並非旨在提供,也不構成TradingView提供或認可的任何形式的財務、投資、交易或其他類型的建議或推薦。請閱讀使用條款以了解更多資訊。