OPEN-SOURCE SCRIPT
Fixed 4H BTC/Altcoins Correlation for Scalping
[ Key Features ]
Fixed 4H Timeframe: The calculation is hardcoded to the 4-hour timeframe. This ensures the correlation value remains stable and relevant for structural analysis while you trade on lower timeframes.
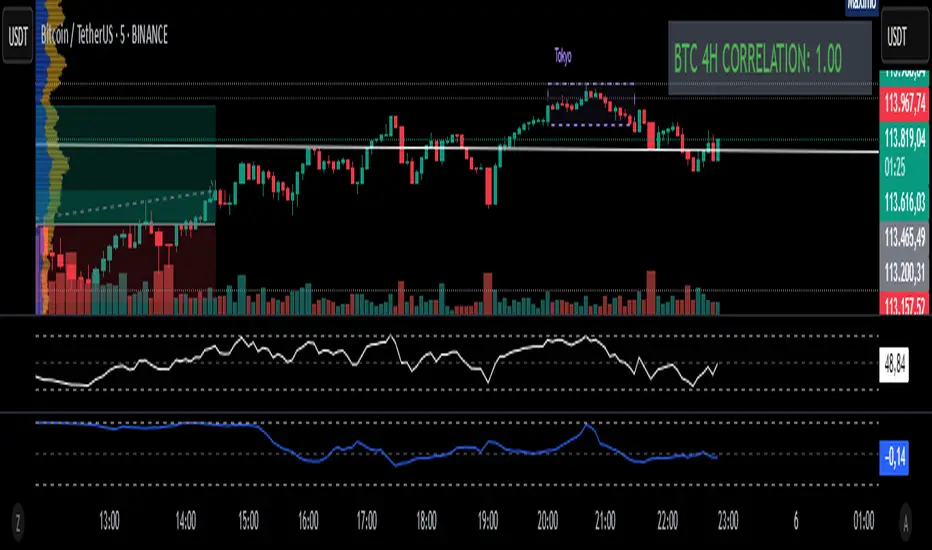
Clean On-Screen Display: Instead of a separate plot line that can clutter the chart, the indicator displays the correlation value in a clean, simple table in the top-right corner.
Dynamic Coloring: The correlation value is color-coded for quick visual assessment:
Green: Strong correlation (> 0.70)
Yellow: Moderate correlation (0.30 to 0.70)
Red: Weak or negative correlation (< 0.30)
Customizable Inputs: Users can easily configure the BTC symbol (e.g., BINANCE:BTCUSDT, COINBASE:BTCUSD), the correlation lookback period (Length), and the price source (Source) to match their reference indicators or preferences.
[ How to Use ]
Add the indicator to your chart (for example, a 5-minute chart of any altcoin).
The table in the top-right corner will immediately display the altcoin's current correlation to BTC, based on 4-hour data.
Use this value to gauge market sentiment. A high positive correlation suggests the altcoin is likely to follow BTC's moves. A low or negative correlation suggests the altcoin is moving independently.
For perfect synchronization with another standard correlation indicator, go to the script's settings (⚙️ icon) and ensure the Length and Source parameters are identical to your reference indicator.
This tool aims to bridge the gap between high-frequency trading and high-timeframe market structure, providing a crucial piece of information in a simple, stable, and accessible format.
Fixed 4H Timeframe: The calculation is hardcoded to the 4-hour timeframe. This ensures the correlation value remains stable and relevant for structural analysis while you trade on lower timeframes.
Clean On-Screen Display: Instead of a separate plot line that can clutter the chart, the indicator displays the correlation value in a clean, simple table in the top-right corner.
Dynamic Coloring: The correlation value is color-coded for quick visual assessment:
Green: Strong correlation (> 0.70)
Yellow: Moderate correlation (0.30 to 0.70)
Red: Weak or negative correlation (< 0.30)
Customizable Inputs: Users can easily configure the BTC symbol (e.g., BINANCE:BTCUSDT, COINBASE:BTCUSD), the correlation lookback period (Length), and the price source (Source) to match their reference indicators or preferences.
[ How to Use ]
Add the indicator to your chart (for example, a 5-minute chart of any altcoin).
The table in the top-right corner will immediately display the altcoin's current correlation to BTC, based on 4-hour data.
Use this value to gauge market sentiment. A high positive correlation suggests the altcoin is likely to follow BTC's moves. A low or negative correlation suggests the altcoin is moving independently.
For perfect synchronization with another standard correlation indicator, go to the script's settings (⚙️ icon) and ensure the Length and Source parameters are identical to your reference indicator.
This tool aims to bridge the gap between high-frequency trading and high-timeframe market structure, providing a crucial piece of information in a simple, stable, and accessible format.
開源腳本
秉持TradingView一貫精神,這個腳本的創作者將其設為開源,以便交易者檢視並驗證其功能。向作者致敬!您可以免費使用此腳本,但請注意,重新發佈代碼需遵守我們的社群規範。
免責聲明
這些資訊和出版物並非旨在提供,也不構成TradingView提供或認可的任何形式的財務、投資、交易或其他類型的建議或推薦。請閱讀使用條款以了解更多資訊。
開源腳本
秉持TradingView一貫精神,這個腳本的創作者將其設為開源,以便交易者檢視並驗證其功能。向作者致敬!您可以免費使用此腳本,但請注意,重新發佈代碼需遵守我們的社群規範。
免責聲明
這些資訊和出版物並非旨在提供,也不構成TradingView提供或認可的任何形式的財務、投資、交易或其他類型的建議或推薦。請閱讀使用條款以了解更多資訊。