PROTECTED SOURCE SCRIPT
Gunzo Trend Sniper For Loop
🧠 Gunzo Trend Sniper For Loop — Adaptive Trend Momentum Framework
The Gunzo Trend Sniper For Loop is a precision-built, adaptive trend analysis system designed to expose hidden trend strength, exhaustion points, and directional momentum within any market — from cryptocurrencies to equities and forex.
At its core, this indicator integrates a loop-based comparative engine with a multi-type adaptive moving average filter, producing a highly responsive yet smooth measure of directional sentiment.
⚙️ Core Concept
Gunzo Trend Sniper quantifies market bias by comparing the current smoothed weighted average of price to its historical values across a dynamic lookback window.
Through this iterative “for loop” scoring process, the indicator tallies how many of the recent bars exhibit higher or lower values than the present one — forming a trend strength score that oscillates between bullish and bearish dominance.
In essence:
Positive score values indicate sustained upward bias — more candles recently closed below the current value.
Negative or low score values signal downward pressure — suggesting that recent candles are outperforming the current value.
📊 Interpreting the Chart
🔍 How to Use It
1. Trend Identification:
When the oscillator consistently remains above the upper threshold, and the overlay line turns green, the market exhibits strong bullish continuation.
Sustained readings below the lower threshold with a red overlay signal dominant bearish control.
2. Entry Confirmation:
Combine this indicator with breakout or pullback setups. For example, enter long positions when:
The oscillator crosses above the upper threshold from below,
The overlay line flips from red to green, confirming new momentum.
Short entries follow the inverse logic.
3. Divergence Detection:
Price forming higher highs while the Gunzo Trend Score forms lower highs may hint at momentum exhaustion — signaling potential reversals.
4. Adaptive Thresholding:
Adjust ThresholdL and ThresholdS to fit volatility.
Tighter thresholds increase sensitivity (useful in lower timeframes).
Wider thresholds filter out noise (ideal for daily or higher intervals).
🧭 Strategic Insights
The Gunzo Trend Sniper is more than an oscillator — it’s a multi-dimensional market bias model.
Its comparative logic captures how consistent recent directional strength has been, effectively quantifying trend persistence. This makes it especially valuable for:
Momentum confirmation before breakouts.
Avoiding false reversals during volatile consolidation phases.
Detecting early trend slowdowns before major reversals.
| Parameter | Description |
| ------------------------------- | ------------------------------------------------------------------- |
| `MA Type` | Selects the smoothing algorithm (SMA, EMA, SMMA, or WMA).
| `MA Source` | Price input (default: OHLC4). |
| `Gunzo Length` | Lookback for the moving average engine. |
| `Smoothing Length` | Additional smoothing layer for refined signals. |
| `From / To` | Defines the historical range for the scoring loop. |
| `Threshold Uptrend / Downtrend` | Determines when a market is considered strongly bullish or bearish. |
💡 Pro Tips
Combine with volume-based indicators or ATR filters for volatility-adjusted entries.
Use in conjunction with higher timeframe confirmation — e.g., align the Gunzo Trend on 4H and 1D for stronger bias.
Works exceptionally well with trend-following strategies, especially when paired with trailing stop systems.
The Gunzo Trend Sniper For Loop is a precision-built, adaptive trend analysis system designed to expose hidden trend strength, exhaustion points, and directional momentum within any market — from cryptocurrencies to equities and forex.
At its core, this indicator integrates a loop-based comparative engine with a multi-type adaptive moving average filter, producing a highly responsive yet smooth measure of directional sentiment.
⚙️ Core Concept
Gunzo Trend Sniper quantifies market bias by comparing the current smoothed weighted average of price to its historical values across a dynamic lookback window.
Through this iterative “for loop” scoring process, the indicator tallies how many of the recent bars exhibit higher or lower values than the present one — forming a trend strength score that oscillates between bullish and bearish dominance.
In essence:
Positive score values indicate sustained upward bias — more candles recently closed below the current value.
Negative or low score values signal downward pressure — suggesting that recent candles are outperforming the current value.
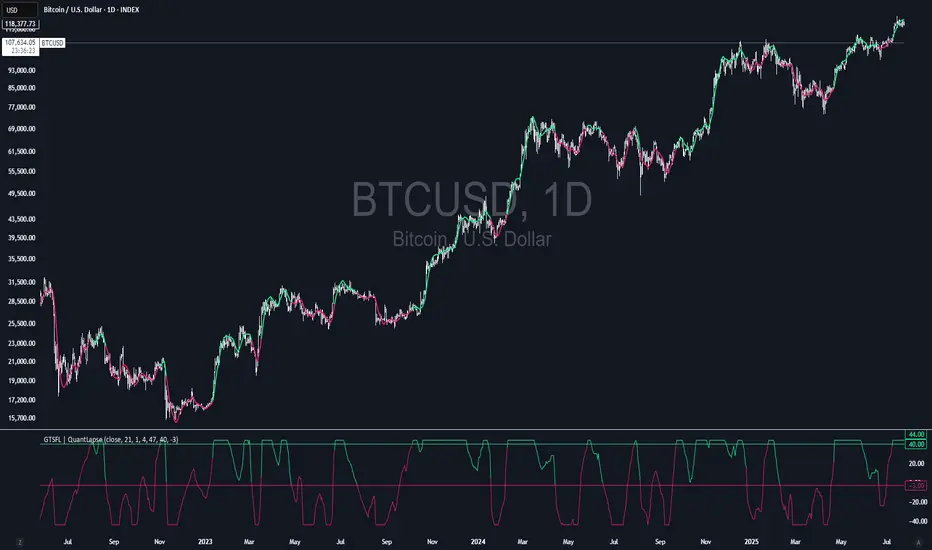
📊 Interpreting the Chart
- The indicator plots two complementary visuals:
- Gunzo Trend Score (Oscillator Panel)
- Green Zones (Above Upper Threshold) → Confirmed uptrend momentum and accumulation.
- Red Zones (Below Lower Threshold) → Confirmed downtrend pressure and potential distribution.
- Neutral Region (Between Thresholds) → Consolidation or transitional phases.
- Gunzo Trend Line (Overlay on Price Chart)
- The plotted line dynamically changes color:
- 🟩 Green: Confirmed bullish trend bias
- 🟥 Red: Confirmed bearish momentum
- ⚪ Gray: Neutral or indecisive period
- This color transition acts as a visual confirmation layer, aligning the oscillator’s internal score with price structure.
🔍 How to Use It
1. Trend Identification:
When the oscillator consistently remains above the upper threshold, and the overlay line turns green, the market exhibits strong bullish continuation.
Sustained readings below the lower threshold with a red overlay signal dominant bearish control.
2. Entry Confirmation:
Combine this indicator with breakout or pullback setups. For example, enter long positions when:
The oscillator crosses above the upper threshold from below,
The overlay line flips from red to green, confirming new momentum.
Short entries follow the inverse logic.
3. Divergence Detection:
Price forming higher highs while the Gunzo Trend Score forms lower highs may hint at momentum exhaustion — signaling potential reversals.
4. Adaptive Thresholding:
Adjust ThresholdL and ThresholdS to fit volatility.
Tighter thresholds increase sensitivity (useful in lower timeframes).
Wider thresholds filter out noise (ideal for daily or higher intervals).
🧭 Strategic Insights
The Gunzo Trend Sniper is more than an oscillator — it’s a multi-dimensional market bias model.
Its comparative logic captures how consistent recent directional strength has been, effectively quantifying trend persistence. This makes it especially valuable for:
Momentum confirmation before breakouts.
Avoiding false reversals during volatile consolidation phases.
Detecting early trend slowdowns before major reversals.
| Parameter | Description |
| ------------------------------- | ------------------------------------------------------------------- |
| `MA Type` | Selects the smoothing algorithm (SMA, EMA, SMMA, or WMA).
| `MA Source` | Price input (default: OHLC4). |
| `Gunzo Length` | Lookback for the moving average engine. |
| `Smoothing Length` | Additional smoothing layer for refined signals. |
| `From / To` | Defines the historical range for the scoring loop. |
| `Threshold Uptrend / Downtrend` | Determines when a market is considered strongly bullish or bearish. |
💡 Pro Tips
Combine with volume-based indicators or ATR filters for volatility-adjusted entries.
Use in conjunction with higher timeframe confirmation — e.g., align the Gunzo Trend on 4H and 1D for stronger bias.
Works exceptionally well with trend-following strategies, especially when paired with trailing stop systems.
受保護腳本
此腳本以閉源形式發佈。 不過,您可以自由使用,沒有任何限制 — 點擊此處了解更多。
免責聲明
這些資訊和出版物並非旨在提供,也不構成TradingView提供或認可的任何形式的財務、投資、交易或其他類型的建議或推薦。請閱讀使用條款以了解更多資訊。
受保護腳本
此腳本以閉源形式發佈。 不過,您可以自由使用,沒有任何限制 — 點擊此處了解更多。
免責聲明
這些資訊和出版物並非旨在提供,也不構成TradingView提供或認可的任何形式的財務、投資、交易或其他類型的建議或推薦。請閱讀使用條款以了解更多資訊。