OPEN-SOURCE SCRIPT
已更新 Market Snap Shot with Pine Screener
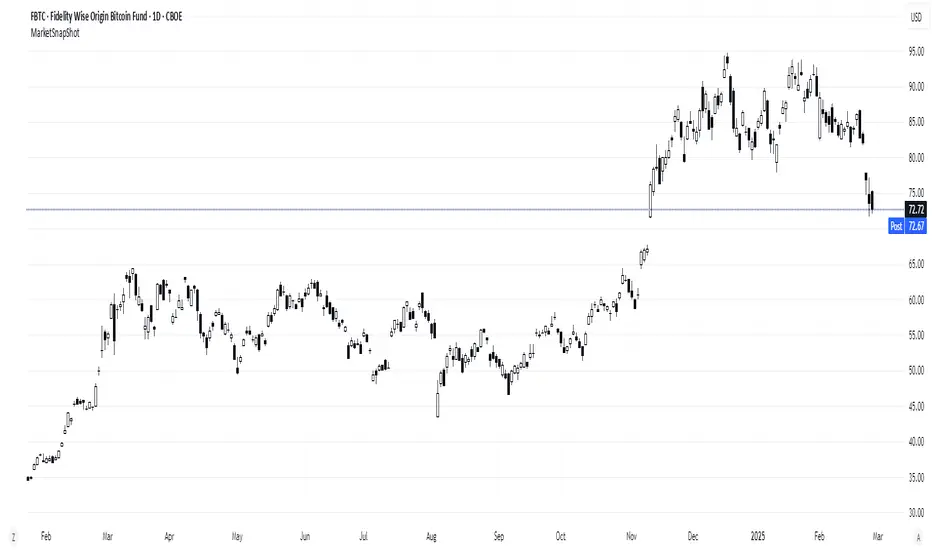
Market Snap Shot
The Market Snap Shot is a comprehensive technical analysis tool designed to track and display key price metrics across multiple timeframes, including daily, weekly, monthly, quarterly, and yearly data. This script provides a range of essential calculations for traders and investors, enabling them to assess price action, volatility, and market trends at a glance.
Features:
Daily Metrics: Includes the daily percentage change, closing range relative to the daily high/low.
Weekly Metrics: Tracks weekly open, close, range, and calculates week-to-date performance for a broader market view.
Monthly Metrics: Provides similar calculations for monthly price action, offering insights into monthly performance.
Quarter-to-Date (QTD): Displays performance for the current quarter, offering insights into quarterly price movements.
Year-to-Date (YTD): Calculates year-to-date price change, helping users track performance relative to the start of the year.
52-Week High/Low: Displays the current price's distance from the 52-week high and low, giving context to long-term price levels.
Usage:
Traders can use this screener to quickly assess the current market position and make informed decisions based on short-term and long-term trends.
Investors can leverage the 52-week and YTD metrics to gauge the overall strength of an asset in the market.
The tool is versatile for both active traders looking for real-time performance data and for those focusing on longer-term market trends.
Instructions:
This script displays multiple metrics such as percentage changes and range data for daily, weekly, monthly, quarterly, and yearly timeframes. It is designed to be used as a screener tool to assess price action and monitor performance across these key time periods.
Warning:
The "Market Snap Shot" does not provide buy or sell signals but rather serves as a performance tracking tool. Users are encouraged to use this data in conjunction with other technical and fundamental analysis tools.
發行說明
This update includes following Scan and sort what is outperforming the SPY ETF with respect to swing low of SPU set at 20, user have option to choose if user want to check performance against SPY swing low or lookback period of choice.
User can check performance of symbols in the watchlist by scanning % price change of lookback period, say market bottomed 12 days ago and want to scan price change vs 12 days performance , input the 12 in "user-Defined Fixed Lookback [PPI]" and untick "Use SPY Lowest Low as Lookback? [PPI]"
Scan which markets has established trends
Short Term EMA10>EMA21
Medium Term SMA20>SMA50
Long Term SMA50>SMA200
Scan Price > SMA 50 AND SMA 200
Scan Price > EMA21,SMA50 AND SMA200
發行說明
Weekly and monthly closing ranges are based on weekly close and monthly close, so added intra week and intra month closing ranges開源腳本
秉持TradingView一貫精神,這個腳本的創作者將其設為開源,以便交易者檢視並驗證其功能。向作者致敬!您可以免費使用此腳本,但請注意,重新發佈代碼需遵守我們的社群規範。
免責聲明
這些資訊和出版物並非旨在提供,也不構成TradingView提供或認可的任何形式的財務、投資、交易或其他類型的建議或推薦。請閱讀使用條款以了解更多資訊。
開源腳本
秉持TradingView一貫精神,這個腳本的創作者將其設為開源,以便交易者檢視並驗證其功能。向作者致敬!您可以免費使用此腳本,但請注意,重新發佈代碼需遵守我們的社群規範。
免責聲明
這些資訊和出版物並非旨在提供,也不構成TradingView提供或認可的任何形式的財務、投資、交易或其他類型的建議或推薦。請閱讀使用條款以了解更多資訊。