INVITE-ONLY SCRIPT
已更新 Accumulation Manipulation PO3 and MMXM
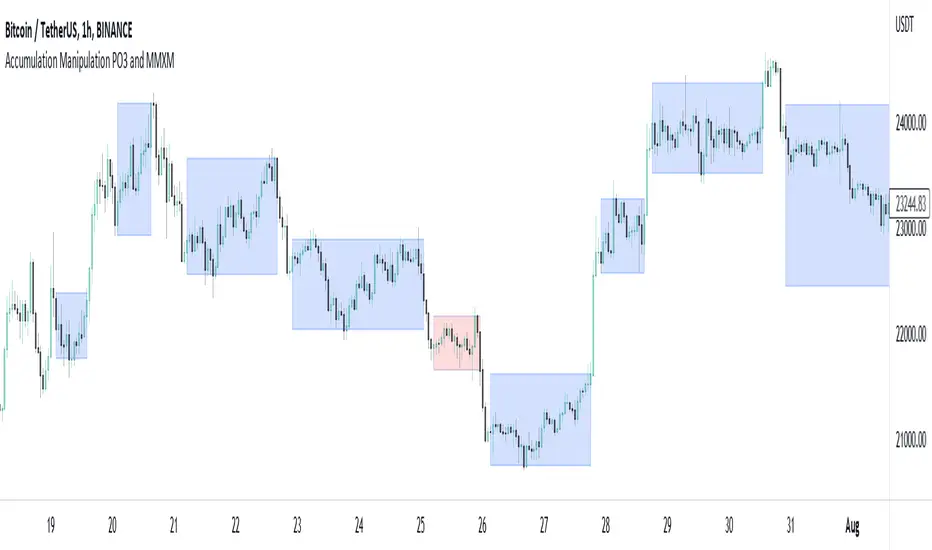
Much is said about the market maker or manipulation of price, but there aren't many indicators that try to show this, until now.
Using an easily customisable, but intelligent algorithm, this indicator tries to find and highlight when price is 'ranging', or 'accumulating'. It does this by looking at changes in price and quantifying the strength of the change, based on current and historical changes, and can therfore decide if price is staying in range or breaking out. By showing this on the chart several approaches can be taken.
Simply, you can trade within the range, and also trade breakouts of the range, knowing that price will react at these range 'levels'.
Alternatively, you can use the accumulation boxes to try and identify MMXM models, that is Market Maker Buy and Market Maker Sell Models, where price moves in phases of consolidation, smart money reversal and re-accumulation.
Finally, using the manipulation detection option, you can try to identify when a sudden change in price is actually manipulation by institutions, and plan to trade the distribution phase accordingly. This accumulation, manipulation, distribution is also known as Power of 3, PO3.
This indicator does not try to teach any of these ideas, only help to visualise them on the chart, and as such should not be considered financial advice.
發行說明
Changed default for 'Show Manipulation' setting to True / On.僅限邀請腳本
只有經作者批准的使用者才能訪問此腳本。您需要申請並獲得使用權限。該權限通常在付款後授予。如欲了解更多詳情,請依照以下作者的說明操作,或直接聯絡Texmoonbeam。
除非您完全信任其作者並了解腳本的工作原理,否則TradingView不建議您付費或使用腳本。您也可以在我們的社群腳本中找到免費的開源替代方案。
作者的說明
Please direct message me on TradingView or Twitter if you would like to try out this indicator or for queries and requests.
Contact me directly on TradingView or Twitter for queries, for purchasing and indicator guides please check here texmoonbeam.notion.site/TradingView-Indicators-by-Texmoonbeam-9f09de3020864ff6a786004af3ba2488
免責聲明
這些資訊和出版物並不意味著也不構成TradingView提供或認可的金融、投資、交易或其他類型的意見或建議。請在使用條款閱讀更多資訊。
僅限邀請腳本
只有經作者批准的使用者才能訪問此腳本。您需要申請並獲得使用權限。該權限通常在付款後授予。如欲了解更多詳情,請依照以下作者的說明操作,或直接聯絡Texmoonbeam。
除非您完全信任其作者並了解腳本的工作原理,否則TradingView不建議您付費或使用腳本。您也可以在我們的社群腳本中找到免費的開源替代方案。
作者的說明
Please direct message me on TradingView or Twitter if you would like to try out this indicator or for queries and requests.
Contact me directly on TradingView or Twitter for queries, for purchasing and indicator guides please check here texmoonbeam.notion.site/TradingView-Indicators-by-Texmoonbeam-9f09de3020864ff6a786004af3ba2488
免責聲明
這些資訊和出版物並不意味著也不構成TradingView提供或認可的金融、投資、交易或其他類型的意見或建議。請在使用條款閱讀更多資訊。