PROTECTED SOURCE SCRIPT
Intraday Market Sentiment @LogicQuest
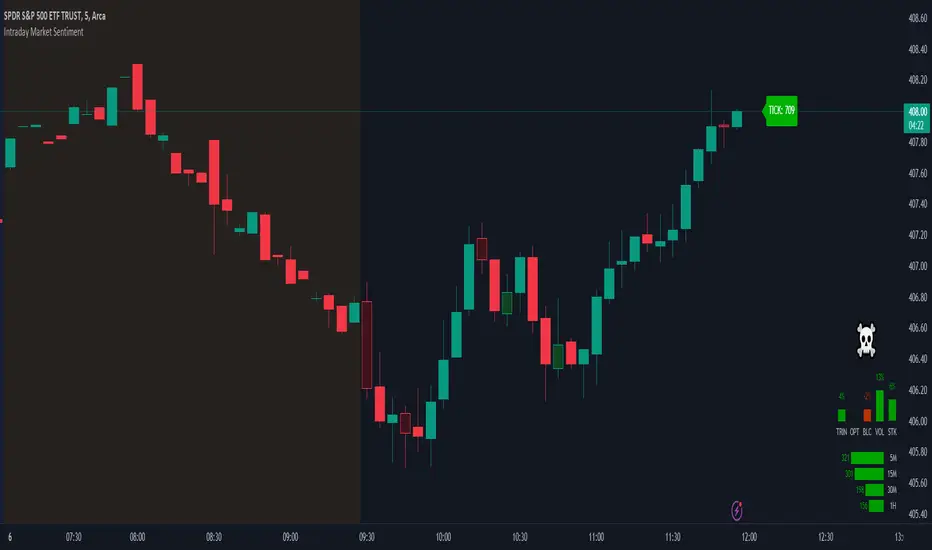
The indicator is designed for use on US stock exchanges during the main trading session. The indicator is a tool for analyzing intraday sentiment in the stock market.
The indicator displays the difference between buying and selling volumes based on the following metrics.
1. TICK - average tick data values for specific time intervals.
2. TRIN (short arbitrage index) - detecting buying and selling pressure and possible trend reversal points.
3. Options - the ratio of purchased and sold option contracts.
4. Blocks - the ratio between the number of shares bought and sold in large blocks.
5. Volumes - the ratio between buying and selling volume.
6. Stocks - the ratio between the number of rising and falling stocks.
7. Price divergence and tick volume.
The data calculation on the chart depends on the settings chosen by the user.
受保護腳本
此腳本以閉源形式發佈。 不過,您可以自由使用,沒有任何限制 — 點擊此處了解更多。
免責聲明
這些資訊和出版物並非旨在提供,也不構成TradingView提供或認可的任何形式的財務、投資、交易或其他類型的建議或推薦。請閱讀使用條款以了解更多資訊。
受保護腳本
此腳本以閉源形式發佈。 不過,您可以自由使用,沒有任何限制 — 點擊此處了解更多。
免責聲明
這些資訊和出版物並非旨在提供,也不構成TradingView提供或認可的任何形式的財務、投資、交易或其他類型的建議或推薦。請閱讀使用條款以了解更多資訊。