OPEN-SOURCE SCRIPT
Stochastic by BTBS
A little word before you are going to use it, this indicator is just a MODIFIED script.
The calculation part is NOT FROM ME, its still the original script by TradingView.
The Usage is still the same as you can take out of the info tab by TradingView.
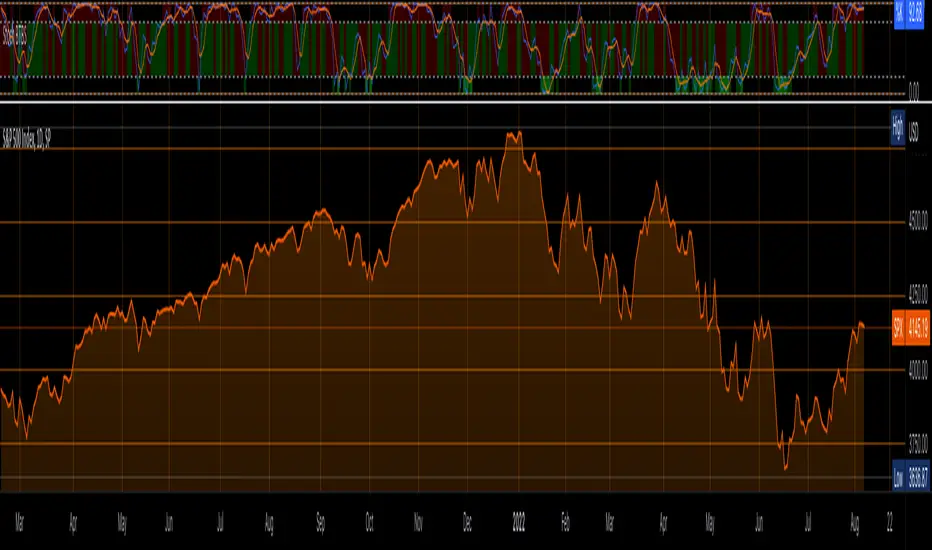
The only difference is that the Color Changes red when:
1. %K is over 80 (Upper Band-High Band)=(OVERBOUGHT)
2. %D lays over %K (%D>%K)
Changes green when:
1.%K is under 20 (Lower Band-Low Band)=(OVERSOLD)
%K lays over %D (%K>%D)
Tell me what I can add or do better :)
Tag me if you use this in a public Analysis :)
The calculation part is NOT FROM ME, its still the original script by TradingView.
The Usage is still the same as you can take out of the info tab by TradingView.
The only difference is that the Color Changes red when:
1. %K is over 80 (Upper Band-High Band)=(OVERBOUGHT)
2. %D lays over %K (%D>%K)
Changes green when:
1.%K is under 20 (Lower Band-Low Band)=(OVERSOLD)
%K lays over %D (%K>%D)
Tell me what I can add or do better :)
Tag me if you use this in a public Analysis :)
開源腳本
秉持TradingView一貫精神,這個腳本的創作者將其設為開源,以便交易者檢視並驗證其功能。向作者致敬!您可以免費使用此腳本,但請注意,重新發佈代碼需遵守我們的社群規範。
免責聲明
這些資訊和出版物並非旨在提供,也不構成TradingView提供或認可的任何形式的財務、投資、交易或其他類型的建議或推薦。請閱讀使用條款以了解更多資訊。
開源腳本
秉持TradingView一貫精神,這個腳本的創作者將其設為開源,以便交易者檢視並驗證其功能。向作者致敬!您可以免費使用此腳本,但請注意,重新發佈代碼需遵守我們的社群規範。
免責聲明
這些資訊和出版物並非旨在提供,也不構成TradingView提供或認可的任何形式的財務、投資、交易或其他類型的建議或推薦。請閱讀使用條款以了解更多資訊。