PROTECTED SOURCE SCRIPT
已更新 (FireflyTA) Adaptive Range
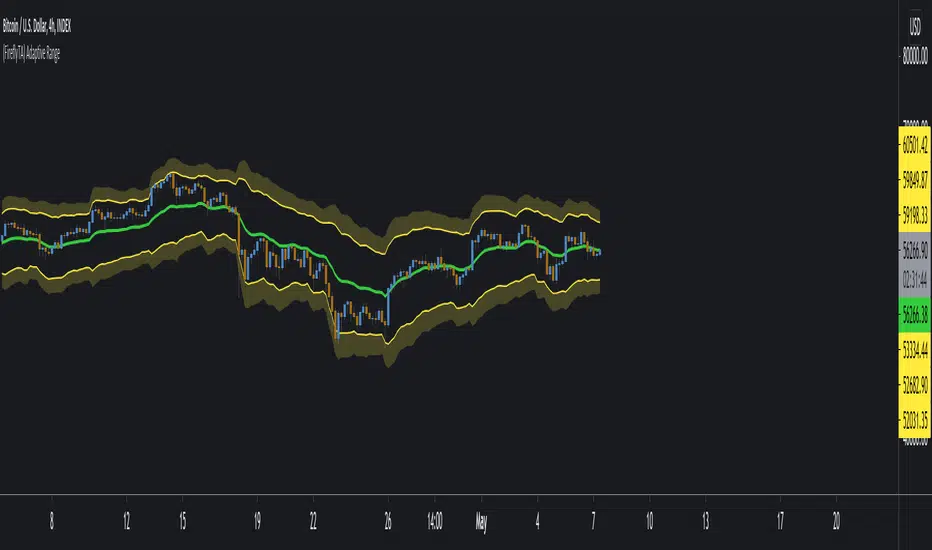
The "Adaptive Range" tool consists of 3 modules that allow simple and advanced range S&R, trend and volatility analysis.
S&R Bands
Are similar to Bollinger Bands but calculated differently. They are more adaptive than traditional Bollinger Bands and take in more data to calculate more reliable S&R.
Center of Gravity
The COG is a 3-dimensional entity and a powerful target of short-term mean reversion. In contrast to a simple moving average for example, this indicator takes in multiple timeframes and multiple volatility metrics (stdev) besides the usual time dimension (length). Whenever price gaining a distance to the COG, expect a move back to it when it is showing weakness at significant S&R.
Adaptive SuperRange
The SuperRange is based on the COG and shows an outlier area which has a strong probability of rejecting price, catapulting it back to the COG. It is unaffected by the timeframe used and can only be customized by adjusting the length and stdev values.
發行說明
v1.1- You can now always use the current chart data by checking "Use Current Chart" - no need to type in the ticker anymore. It is still useful though in case you want to access data from a different market, i.e. BITSTAMP:BTCUSD data on a Bitmex chart.
- Some minor optimizations to the code and usability. Also added a reference to the YouTube tutorial on how to use the indicator.
發行說明
- Some minor changes
受保護腳本
此腳本以閉源形式發佈。 不過,您可以自由使用,沒有任何限制 — 點擊此處了解更多。
Crypto TA & FireflyTA indicator tutorials:
Twitter: twitter.com/FireflyTA
YouTube: youtube.com/channel/UC3Hxf0omt3dMqAxGQBnXJPA
Discord: t.co/Ky7gE7zfja
Twitch: twitch.tv/fireflyta
Twitter: twitter.com/FireflyTA
YouTube: youtube.com/channel/UC3Hxf0omt3dMqAxGQBnXJPA
Discord: t.co/Ky7gE7zfja
Twitch: twitch.tv/fireflyta
免責聲明
這些資訊和出版物並非旨在提供,也不構成TradingView提供或認可的任何形式的財務、投資、交易或其他類型的建議或推薦。請閱讀使用條款以了解更多資訊。