OPEN-SOURCE SCRIPT
已更新 Running Minimum High
The running minimum high looks at the minimum high from a defined lookback period (default 10 days) and plots that on the price chart. Green arrows signify when the low of the candle is above the running minimum high (suggesting an uptrend), and red arrows signify when the high of the candle is below the running minimum high (suggesting a downtrend).
It is recommended to use this on high timeframes (e.g. 1 hour and above) given the high number of signals it generates on lower timeframes.
It is recommended to use this on high timeframes (e.g. 1 hour and above) given the high number of signals it generates on lower timeframes.
發行說明
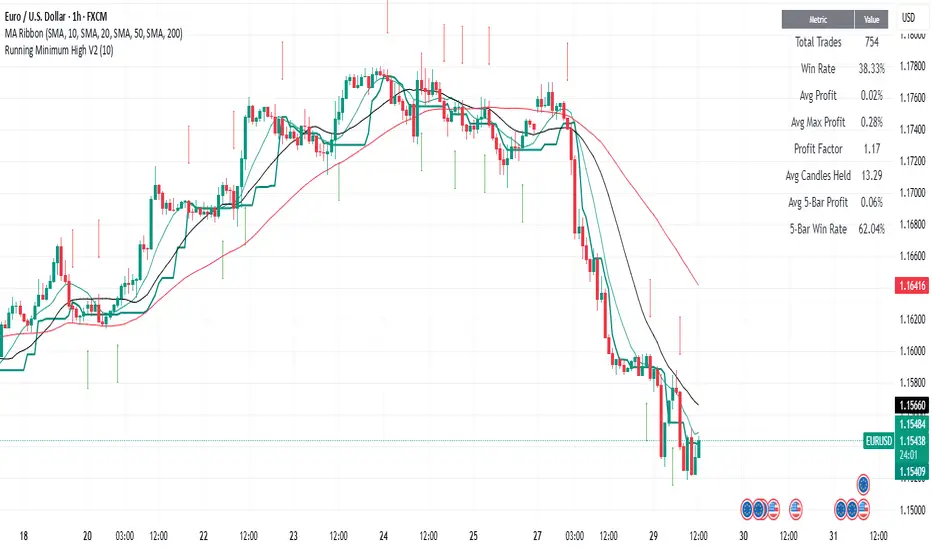
The running minimum high looks at the minimum high from a defined lookback period (default 10 days) and plots that on the price chart. Green arrows signify when the low of the candle is above the running minimum high (suggesting an uptrend), and red arrows signify when the close of the candle is below the running minimum high (suggesting a downtrend).It is recommended to use this on high timeframes (e.g. 1 hour and above) given the high number of signals it generates on lower timeframes.
EDIT: Changed exit signal to when close is below minimum high.
發行說明
JULY 29TH UPDATE: Includes profit table, which shows overall profit calculations and profit after 5 bars with the option to show the profits in pips (EUR-USD style) for FOREX,開源腳本
秉持TradingView一貫精神,這個腳本的創作者將其設為開源,以便交易者檢視並驗證其功能。向作者致敬!您可以免費使用此腳本,但請注意,重新發佈代碼需遵守我們的社群規範。
免責聲明
這些資訊和出版物並非旨在提供,也不構成TradingView提供或認可的任何形式的財務、投資、交易或其他類型的建議或推薦。請閱讀使用條款以了解更多資訊。
開源腳本
秉持TradingView一貫精神,這個腳本的創作者將其設為開源,以便交易者檢視並驗證其功能。向作者致敬!您可以免費使用此腳本,但請注意,重新發佈代碼需遵守我們的社群規範。
免責聲明
這些資訊和出版物並非旨在提供,也不構成TradingView提供或認可的任何形式的財務、投資、交易或其他類型的建議或推薦。請閱讀使用條款以了解更多資訊。