OPEN-SOURCE SCRIPT
Horizontal lines by Aydmaxx
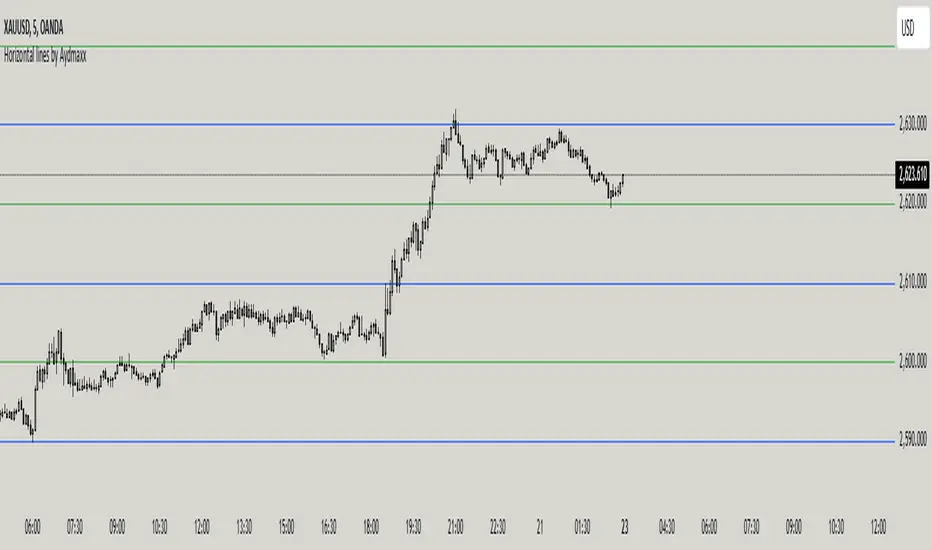
Indicator Description: Horizontal Lines by Aydmaxx
This indicator plots customizable horizontal lines on the chart to assist with technical analysis. It allows traders to define a starting price and a step size (gap) between the lines, making it versatile for a variety of strategies, such as identifying support, resistance, or key price levels.
How to Use:
Starting Price (Bottom): Enter the price level where the first (lowest) line should begin. This is your base level.
Example: If you're analyzing a market with prices around 2550, you can set this value to 2550 to align the indicator with your focus.
Gap (Step Size): Specify the interval or step size between consecutive lines.
Example: If you want lines every 10 points, set this value to 10.
Number of Lines: Adjust the total number of lines to display on the chart.
Line Style and Width: Customize the appearance of the lines (solid, dashed, dotted) and their thickness.
Line Colors and Transparency: Choose primary and secondary colors for alternating lines, and adjust the transparency to match your visual preferences.
This indicator is ideal for visualizing price zones and can be tailored to suit any trading style. Adjust the parameters based on your market analysis to highlight key price levels effectively.
開源腳本
秉持TradingView一貫精神,這個腳本的創作者將其設為開源,以便交易者檢視並驗證其功能。向作者致敬!您可以免費使用此腳本,但請注意,重新發佈代碼需遵守我們的社群規範。
免責聲明
這些資訊和出版物並非旨在提供,也不構成TradingView提供或認可的任何形式的財務、投資、交易或其他類型的建議或推薦。請閱讀使用條款以了解更多資訊。
免責聲明
這些資訊和出版物並非旨在提供,也不構成TradingView提供或認可的任何形式的財務、投資、交易或其他類型的建議或推薦。請閱讀使用條款以了解更多資訊。