PROTECTED SOURCE SCRIPT
已更新 Ichimoku + Forecast + Signals
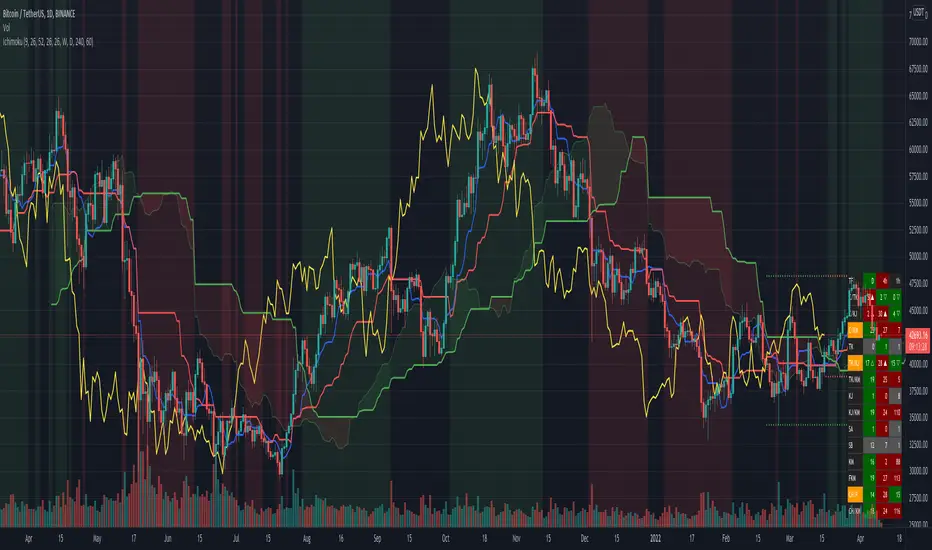
Ichimoku Kinko Hyo (IKH) (Japanese一目均衡表, Ichimoku Kinkō Hyō), usually shortened to "Ichimoku", is a technical analysis method that builds on candlestick charting to improve the accuracy of forecast price moves. - From Wikipedia, the free encyclopedia
This indicator is enhanced with the following helpful features:
Signals description:
This indicator is enhanced with the following helpful features:
- Tenkan-sen, Kijun-sen, Senkou Span A and Senkou Span B 5 days forecast
- identified bullish (green color), bearish (red color), or flat/within (gray color) signals including the number of days it accrued from the last bar and the place of appearance (▲ - above bullish Kumo, △ - above bearish Kumo, ◆ - within bullish Kumo, ◇ - within bearish Kumo, ▼ - bellow bullish Kumo, ▽ - bellow bearish Kumo)
- lines indicating the range of the Tenkan-sen, Kijun-sen, and Senko Span B calculations (we can easily identify the highest-high and the lowest-low of the range and how long it will persist)
Signals description:
- C/TK - bullish/bearish Close/Tenkan-sen cross
- C/KJ - bullish/bearish Close/Kijun-sen cross
- C/KM - bullish/bearish/within Close/Kumo cross
- TK - bullish/bearish/flat Tenkan-sen
- TK/KJ - bullish/bearish Tenkan-sen/Kijun-sen cross
- TK/KM - bullish/bearish/within Tenkan-sen/Kumo cross
- KJ - bullish/bearish/flat Kijun-sen
- KJ/KM - bullish/bearish/within Kijun-sen/Kumo cross
- SA - bullish/bearish/flat Senkou Span A
- SB - bullish/bearish/flat Senkou Span B
- KM - bullish/bearish Kumo
- FKM - bullish/bearish future Kumo
- CH/P - bullish/bearish Chikou Span/Price cross
- CH/KM - bullish/bearish/within Chikou Span/Kumo cross
發行說明
- added Tenkan-sen, Kijun-sen, and Senko Span B range breakouts (indicated by ↗ if the price break out upper range and ↘ for breaking down the lower range)
- now you can select the signals which construct bullish (buy) or bearish (sell) condition. By default it is a price crossing Kumo, Tenkan crossing Kijun and Chikou breaking a price. For bullish condition, which will be coloured green on the chart, all signals must be bullish.
- added multi timeframe Ichimoku signals (max 4 timeframes + current one)
受保護腳本
此腳本以閉源形式發佈。 不過,您可以自由使用,沒有任何限制 — 點擊此處了解更多。
免責聲明
這些資訊和出版物並非旨在提供,也不構成TradingView提供或認可的任何形式的財務、投資、交易或其他類型的建議或推薦。請閱讀使用條款以了解更多資訊。
免責聲明
這些資訊和出版物並非旨在提供,也不構成TradingView提供或認可的任何形式的財務、投資、交易或其他類型的建議或推薦。請閱讀使用條款以了解更多資訊。