PROTECTED SOURCE SCRIPT
已更新 RSI Exhaustion + Divergence
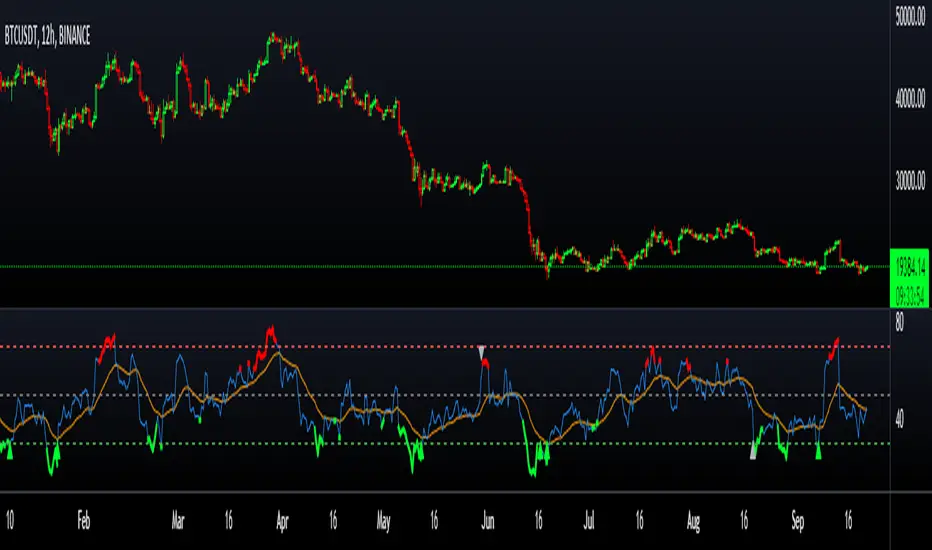
The Relative Strength Index Exhaustion with Divergence is an essential replacement of the standard Relative Strength Index Oscillator because it's able to identify and highlight hidden exhaustions together with Bullish/Bearish Regular and Hidden Divergences.
This indicator can give the outmost probability in spotting trend reversals or trend continuation.
By identifying hidden exhaustion momentum, the Relative Strength Index Exhaustion indicator represents an essential support to the trader in effectively reading the market and grabbing the best opportunities.
This detects divergences between price and indicator with 1 candle delay so it filters out repeating divergences.
Recommended to use this at a higher timeframe to lessen the false signals.
Red Arrow = Bullish/Bearish Divergence
White Arrow = Hidden Bullish/Bearish Divergence
發行說明
Added input source.受保護腳本
此腳本以閉源形式發佈。 不過,您可以自由使用,沒有任何限制 — 點擊此處了解更多。
免責聲明
這些資訊和出版物並非旨在提供,也不構成TradingView提供或認可的任何形式的財務、投資、交易或其他類型的建議或推薦。請閱讀使用條款以了解更多資訊。
免責聲明
這些資訊和出版物並非旨在提供,也不構成TradingView提供或認可的任何形式的財務、投資、交易或其他類型的建議或推薦。請閱讀使用條款以了解更多資訊。