OPEN-SOURCE SCRIPT
已更新 Candle Information Panel
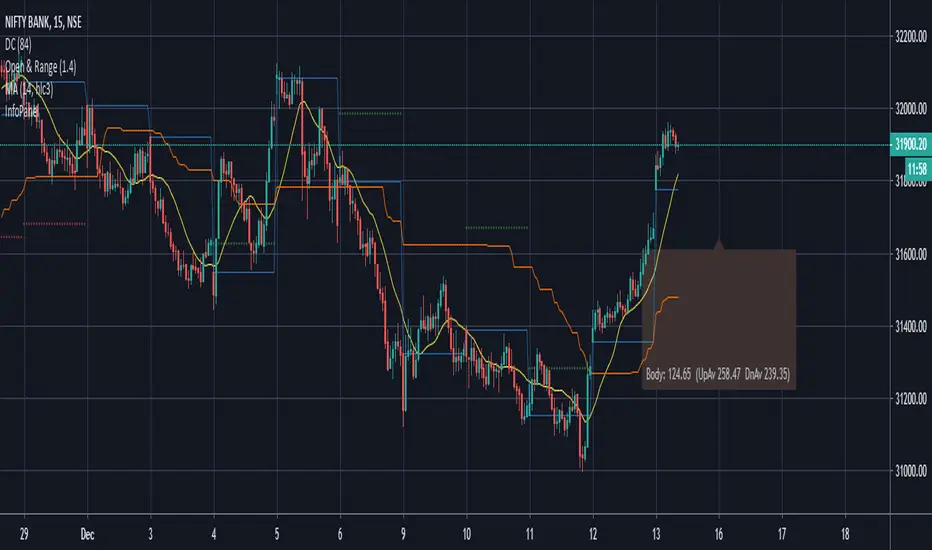
//This indicator shows Day's candle measurements with past averages. First column shows the candle details for the present day.
//"Open - Low", "High - Open", "Range(=High-low)", "Body(open-close)"
//Averages are calculated for occurences of Green and Red days. Up Averages are for Green days and Down Averages are for Red days.
//Average are not perfect calculations since occurences(of Red or Green) will vary within the timespan used for averages.
//This can used to guage general sense of probability of the price movement.
//e.g. if the Open to Low for a day exceeds UpAv value, then there is higher likelihood of day being Red.
//similarly, trade can be held in expectation of price reaching the DnAv and stop loss can be trailed accordingly.
//Not a perfect system. But something to work on further to increase price action understanding.
//Be careful on days where consecutive 3rd Highest High or Lowest Low day is made and also on the next day after such day. Prices may turn direction at least for a short while.
Complete Credit goes to PineCoders who gave me the main script on tradingview chat room.
發行說明
Revision 1 - Corrected formula for body calculation.開源腳本
秉持TradingView一貫精神,這個腳本的創作者將其設為開源,以便交易者檢視並驗證其功能。向作者致敬!您可以免費使用此腳本,但請注意,重新發佈代碼需遵守我們的社群規範。
免責聲明
這些資訊和出版物並非旨在提供,也不構成TradingView提供或認可的任何形式的財務、投資、交易或其他類型的建議或推薦。請閱讀使用條款以了解更多資訊。
免責聲明
這些資訊和出版物並非旨在提供,也不構成TradingView提供或認可的任何形式的財務、投資、交易或其他類型的建議或推薦。請閱讀使用條款以了解更多資訊。